Navigating the Future of Data Management: An In-depth Exploration of Knowledge Graphs and Their Transformative Effects on the Information Age
In the era of digital transformation, data management is no longer just about storing and securing information. It’s about leveraging data to gain insights, predicting future trends, and making informed decisions. The advent of Artificial Intelligence (AI) and the proliferation of unstructured data have propelled us into the golden era of data science, where data plays a pivotal role in revolutionizing industries across the board. A key player in this data revolution is the knowledge graph, a powerful framework for organizing, storing, and querying information.
What are Knowledge Graphs?
Knowledge graphs (KGs) are an innovative approach for managing structured data that is created by representing information as entities and their relationships. These entities are linked with properties and can be complex, like nodes in a graph, hence the term “knowledge graph.” Conceptually, a knowledge graph is a collection of interlinked data pieces that form a coherent structure to provide deep insight into the relationships between information entities.
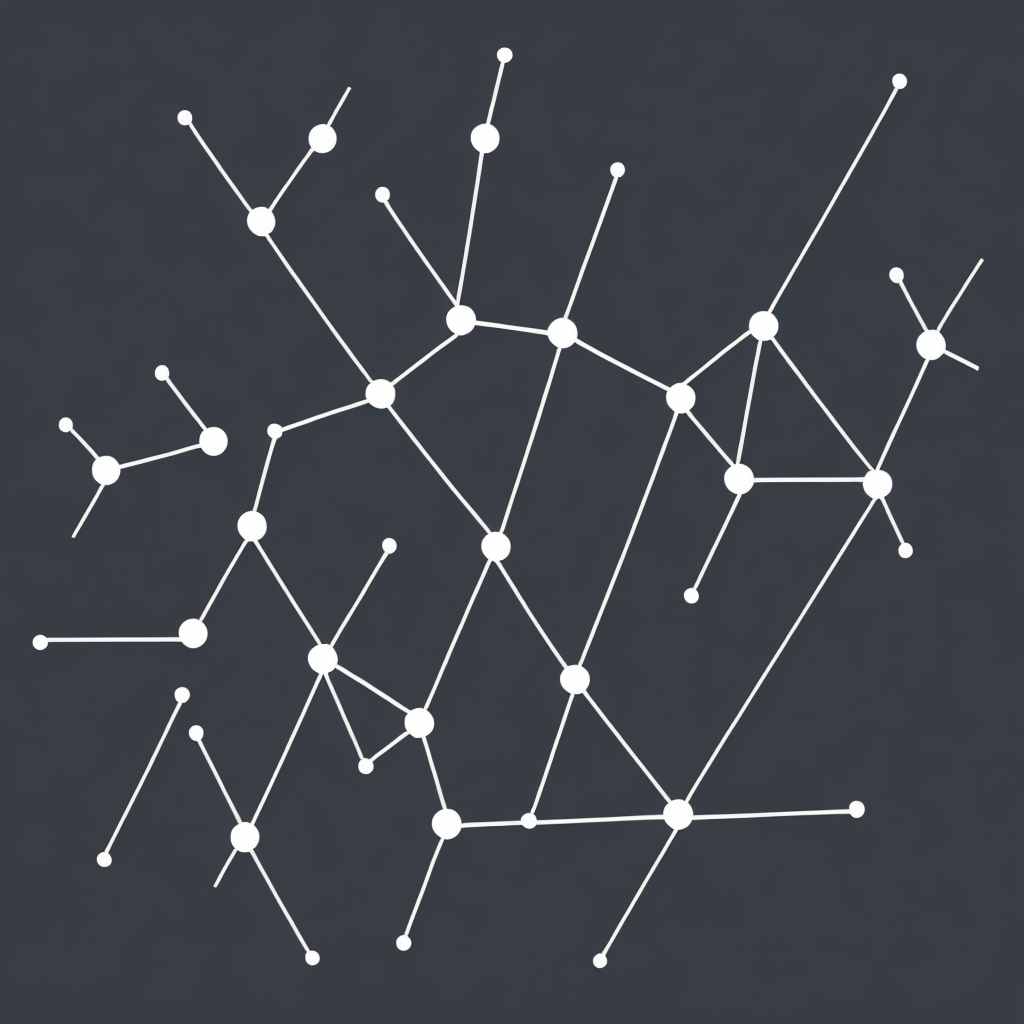
Inherently, a knowledge graph comprises a multitude of nodes, representing concepts such as people, places, events, and things, connected by edges that embody the relationships between these entities—relationships like “is a part of,” “related to,” “causes,” and so on. This structured manner of representation allows for a much greater level of detail and insight than traditional databases, which typically store data in a flat, tabular manner.
A Knowledge Graph’s Structure and How it Operates
The operational mechanism of knowledge graphs involves various functions, including:
1. **Data Extraction**: This involves collecting the data from various sources, which could be databases, web pages, or other data repositories, and enriching it with additional context and structure.
2. **Ontology Design**: An ontology is a fundamental part of a knowledge graph that defines the relationships and attributes of each entity. It provides a structured framework for the graph’s nodes and edges, helping to ensure consistency and coherence.
3. **Data Munging**: This step involves preparing the data for its use in the graph, which might include normalization, standardization, and validation to ensure the data’s quality and integrity.
4. **Querying**: Once the data is in place, knowledge graphs allow for complex, yet natural language-like queries that return detailed insights, linking together various entities and relationships to provide a broader context.
5. **Inference and Reasoning**: Using logic and statistical methods, knowledge graphs can infer new relationships and insights that are not explicitly present in the data but are implied by the knowledge modeled within the graph.
6. **Enrichment and Expansion**: Over time, these graphs can grow and evolve, as new data is integrated, relationships are enriched, and insights are gained.
Transformative Effects of Knowledge Graphs
The adoption of knowledge graphs has several transformative effects in the Information Age:
1. **Enhanced Data Analysis and Insights**: Knowledge graphs enable deeper, more meaningful analysis of data, uncovering hidden patterns, correlations, and insights that might be missed in less structured data formats.
2. **Better Decision-Making**: Due to the detailed and interconnected nature of knowledge graphs, they support more informed and strategic decision-making by providing a comprehensive view of the underlying data.
3. **Improved AI and ML**: Knowledge graphs serve as excellent data sources for training AI and machine learning models, especially in domains requiring domain-specific knowledge, making these models more accurate and robust.
4. **Integration and Interoperability**: Knowledge graphs facilitate integration across different data silos and domains, improving data interoperability and allowing for seamless data-driven innovation.
5. **Business Intelligence and Analytics**: They play a crucial role in business intelligence by enabling real-time analytics, predictive modeling, and scenario simulations, enhancing businesses’ ability to adapt to market changes and optimize operations.
6. **User-Centric Applications**: Knowledge graphs empower the development of personalized and intelligent applications across various sectors, from healthcare and customer experience to finance and entertainment, by providing tailored and context-aware information.
In conclusion, knowledge graphs represent a powerful tool for organizations to navigate the complex and voluminous data landscape of the Information Age. As technology continues to evolve, the integration of AI with knowledge graphs is poised to unlock unprecedented levels of intelligence and efficiency, driving innovation, and opening new frontiers in data management and exploitation. These graphs are poised not just to manage data, but to transform it into actionable insights and strategic advantages.