Decoding the Power of Knowledge Graphs: Enhancing Data Understanding and Decision Making
In the ever-evolving landscape of data-driven decision making, one concept that has gained significant prominence is that of Knowledge Graphs. These sophisticated network data structures have the capability to revolutionize the manner in which organizations understand, analyze, and utilize information to strategize and operate for improved outcomes. The power of knowledge graphs resides in their unique ability to capture complex, interconnected relationships and provide deep insights into data.
**Understanding Knowledge Graphs**
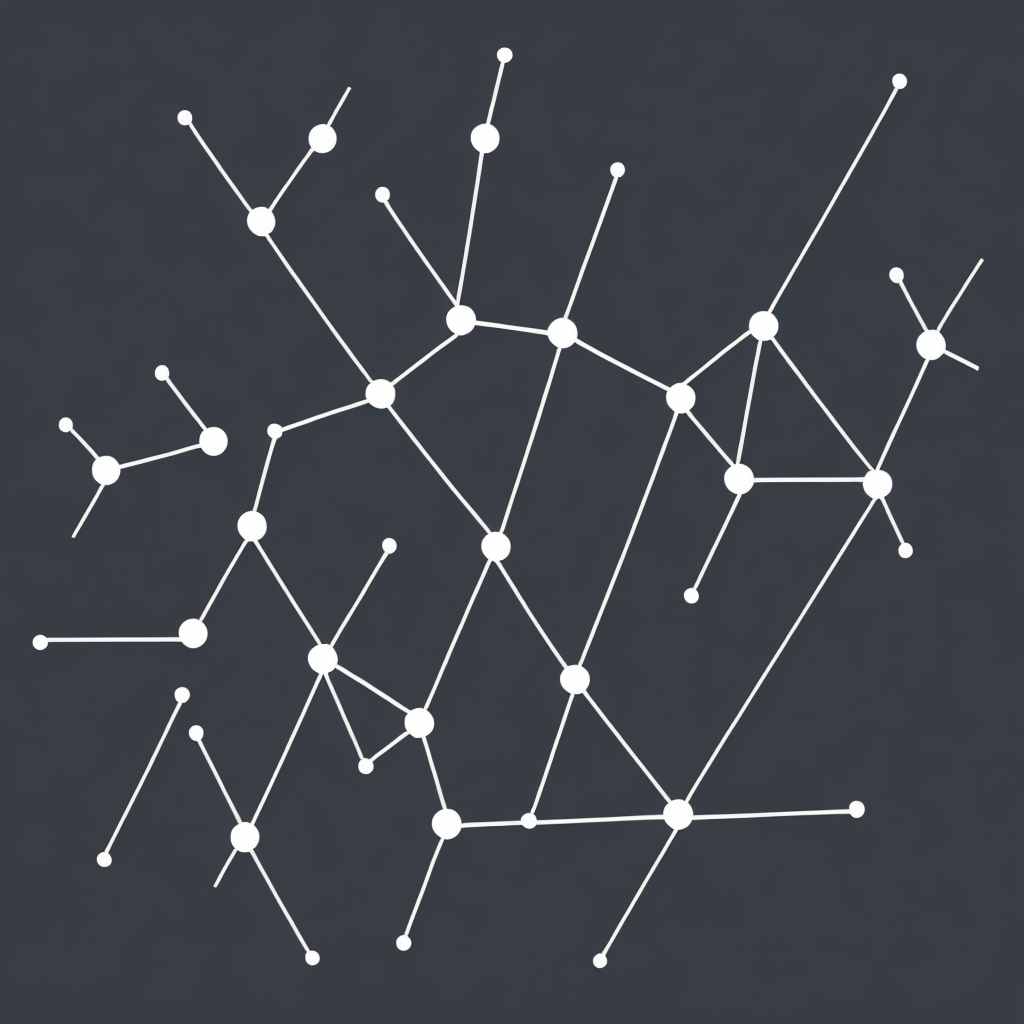
A Knowledge Graph is essentially a dynamic, interconnected collection of data points, often referred to as nodes, which are linked by relationships. Nodes typically represent entities such as people, places, things, or concepts, while edges depict the relationships and interactions between these entities. This system ensures that even if individual pieces of information seem disjointed or disconnected, their true interconnectivity can be deciphered, thereby revealing underlying patterns and structures.
**Enhancing Data Understanding**
In the realm of data understanding, knowledge graphs play a pivotal role. By visually illustrating the relationships between various data elements, these graphs enable stakeholders to see the big picture. This visualization can be particularly beneficial when dealing with vast, complex datasets. Knowledge graphs simplify the understanding of interrelationships and dependencies among datasets, making it easier to identify trends, correlations, and anomalies.
Moreover, knowledge graphs facilitate the integration of diverse data sources, providing a unified view that transcends the limitations of traditional data silos. This integration capability is a game-changer in an era where disparate data resides in different formats, databases, and systems. Knowledge graphs enable cross-domain data insights, which are invaluable for informed decision making.
**Empowering Decision Making**
The true power of knowledge graphs lies in their ability to support decision making through deeper insights and predictive capabilities. Unlike conventional data analysis methods that often focus on descriptive statistics, knowledge graphs can leverage the interconnected data to provide predictive analytics. This predictive capacity is particularly useful in anticipating trends, outcomes, and possibilities, allowing organizations to make proactive decisions rather than reactive ones.
Knowledge graphs can also optimize decision-making processes by filtering out irrelevant information, focusing on essential variables, and highlighting those that carry the greatest predictive value. This filtering mechanism ensures that decision-makers are presented with relevant, high-impact data, leading to more efficient and effective decision making.
**Conclusion**
In essence, knowledge graphs are powerful tools for enhancing both data understanding and decision making. By illuminating the intricate web of relationships within data, they provide organizations with a more complete picture of their operational landscape. This capability ensures that data-driven decisions are not only based on relevant and connected information but are also informed by an understanding of how different aspects of the business are interconnected. As technology continues to advance, the true potential of knowledge graphs is yet to be fully explored, making them a critical component in the arsenal of data-driven organizations aiming to optimize performance, innovation, and strategic outcomes.
