Decoding the Power of Knowledge Graphs: Enhancing Data Understanding and Decision Making in the Digital Age
As the digital age unfolds, it’s crucial to explore and harness every tool at our disposal for effective data management and decision-making. One such instrument, the knowledge graph, holds the promise to revolutionize the way we process and interpret information. Unveiling the intricacies and advantages of knowledge graphs, this article deciphers their potential in enhancing data understanding and decision-making processes.
1. **What is a Knowledge Graph?**
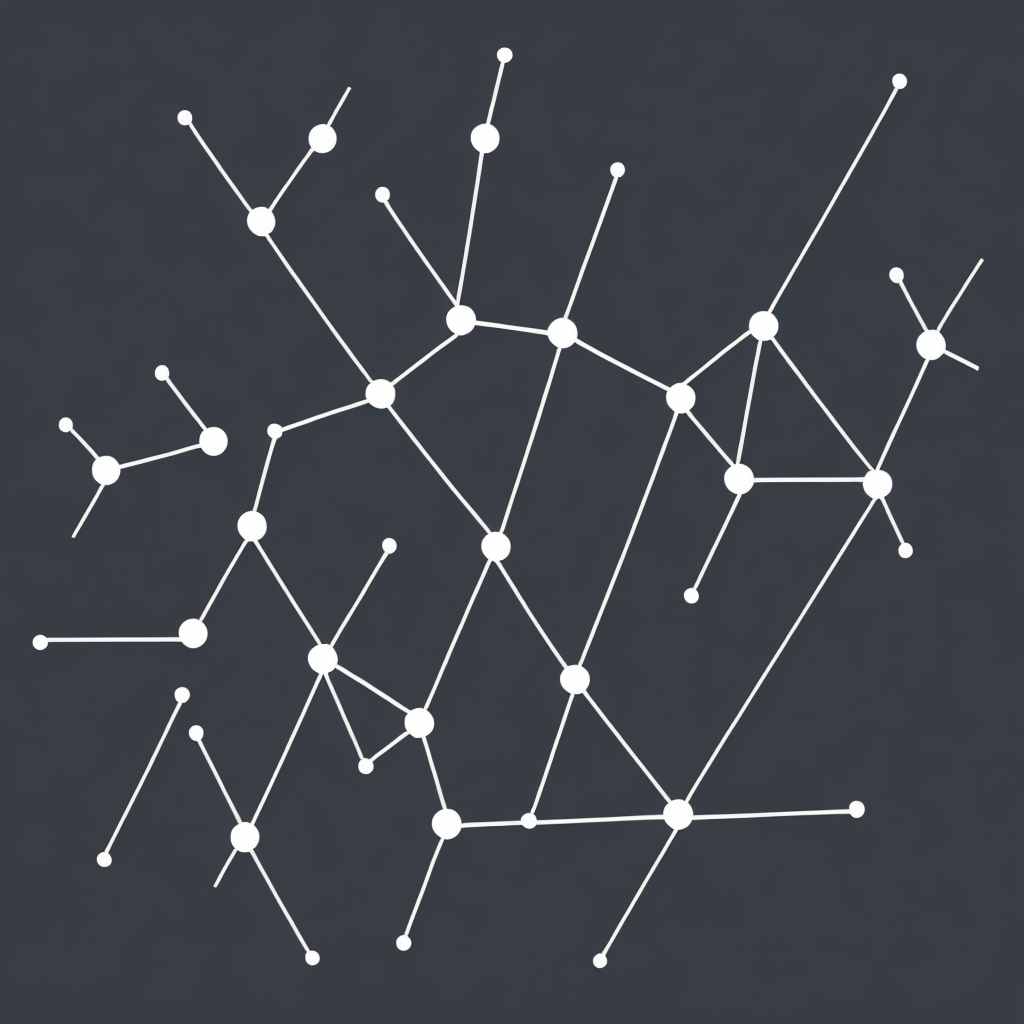
A knowledge graph is a scalable data structure designed to map between data points and represent real-world entities and relationships between them in a structured format. Unlike traditional flat data storage, the value lies in the relationships between entities, enabling deeper understanding and easier retrieval of information.
1. **Structured Data Representation**
The power of knowledge graphs comes from their ability to represent data as semantic relationships. This means storing not just the facts, but also the connections and rules that govern their meaning. For instance, rather than presenting facts as unrelated attributes like “John has a height of 180cm,” a knowledge graph would include entities “John,” “John’s height,” and “180cm,” with directed relationships delineating the connection. This structure allows for more nuanced searches and queries, beyond simple searches for a particular fact.
1. **Enhancing Data Understanding**
The structured relationship within knowledge graphs leads to improved data comprehension. By visualizing data as interconnected nodes, users can see how various pieces of information relate to one another in a holistic manner. This aids in recognizing patterns, connections, and implications that might not be apparent in traditional data formats. For example, in the healthcare sector, a knowledge graph could help researchers link symptoms, diagnoses, and treatments more efficiently, aiding in clinical decision-making.
1. **Decision Making**
Knowledge graphs significantly boost decision-making capabilities by providing a comprehensive, connected view of the data universe. A business, for instance, can use a knowledge graph to analyze consumer behavior, link product offerings to customer demographics, and understand competitive landscapes. This enhanced visibility can help in formulating more informed strategies, optimizing product offerings, and personalizing customer interactions. Moreover, the dynamic nature of the relationships within a knowledge graph allows businesses to adapt to changes quickly, making them more responsive in volatile markets.
1. **Integration and Scalability**
Knowledge graphs facilitate seamless data integration across various silos and sources, creating a cohesive repository of interconnected knowledge. As the amount of digital data grows exponentially, the ability to connect diverse data sources becomes more crucial. Knowledge graphs offer a scalable solution, allowing them to handle vast datasets while maintaining the ability to infer new relationships and answers to complex queries. This scalability is instrumental in supporting modern data ecosystems.
1. **Conclusion**
In the quest for information and insight in a digital age, knowledge graphs stand out as a promising tool for data understanding and decision-making. By structuring data in a semantic, interconnected way, knowledge graphs enable users to uncover new patterns, improve connections, and inform decisions with a deeper understanding of the underlying realities. As technology evolves, the role and capabilities of knowledge graphs are likely to expand, presenting unprecedented opportunities for innovation and efficiency in a wide range of fields.
