Unleashing the Potential of Knowledge Graphs: A Comprehensive Guide to Enhancing Data Understanding and Decision-Making Processes
The advancement of technology has marked a new era of data-driven decision-making, where vast quantities of data are being generated at an unprecedented speed. Organizations across different sectors are realizing the immense value that a deep understanding of this data can bring to their operations, from optimizing product strategies to improving customer experiences. Central to this transformation lies the concept of knowledge graphs, an intuitive way to manage and visualize relationships between different data entities.
### What are Knowledge Graphs?
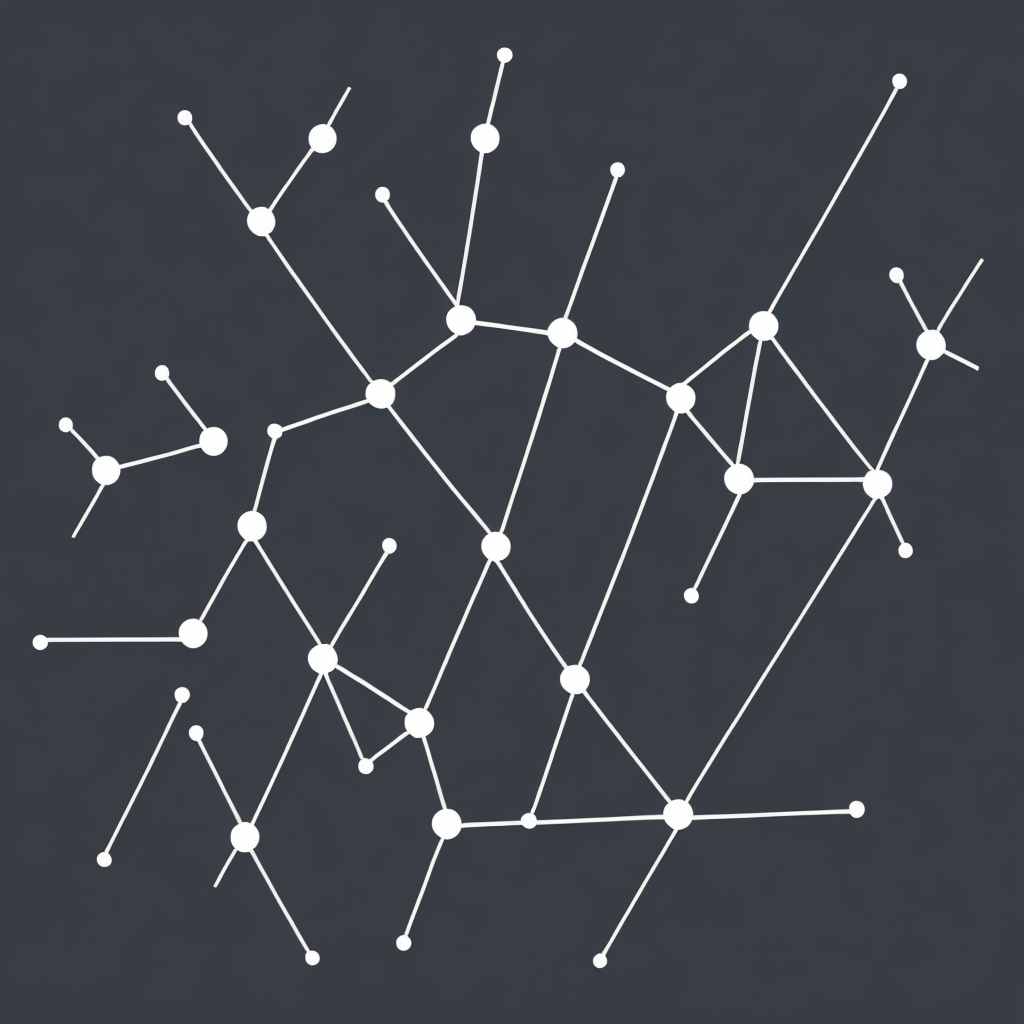
Fundamentally, knowledge graphs are structured networks that represent information as interconnected nodes and edges, where nodes serve as entities such as people, places, things, or concepts, and edges establish relationships between these nodes. This framework makes it easier to comprehend complex data landscapes, extract meaningful patterns, and make informed decisions.
### Benefits of Knowledge Graphs
1. **Enhanced Data Understanding**: By visualizing data in a structured network, knowledge graphs facilitate a deeper understanding of the relationships and patterns underlying the data. This leads to more insightful analysis and quicker comprehension of intricate datasets.
2. **Improved Decision-Making**: Knowledge graphs provide a holistic view of all related data points, enabling data-driven decision-making. Stakeholders can quickly access relevant information and make decisions with confidence.
3. **Efficient Data Search and Retrieval**: Structured data within knowledge graphs allows for more efficient queries and search capabilities, accelerating the process of finding pertinent information for various analytical tasks.
4. **Support for Predictive Analytics**: Knowledge graphs enable the modeling of relationships and predictive insights. By integrating data from various sources, businesses can predict trends, behaviors, and outcomes, fostering proactive strategy development.
5. **Facilitating Natural Language Processing (NLP)**: Knowledge graphs can be queried using natural language, making complex data more accessible to a wide audience. This is particularly useful in customer-facing applications, enhancing the customer experience through personalized interactions.
### Creating Your Own Knowledge Graph
Developing a robust knowledge graph involves several key steps:
1. **Data Collection**: Gather structured and unstructured data from various sources such as databases, APIs, and web scraping. Ensure the data is relevant and cleansed of inconsistencies.
2. **Data Integration**: Merge the collected data into a unified framework, resolving schema discrepancies to ensure seamless interoperability across different data entities.
3. **Entity Recognition and Resolution**: Identify and standardize entities to ensure they are represented consistently throughout the graph. This step is crucial for accurate analysis and querying.
4. **Relationship Mapping**: Define and populate relationships between entities based on their interconnections. This might involve automatic inference or manual curation, depending on the required level of detail.
5. **Validation and Testing**: Validate the accuracy and completeness of the knowledge graph through rigorous testing and feedback loops. This ensures the graph remains reliable and serves its intended purpose effectively.
### Tools and Technologies
A variety of tools and technologies are available to help manage and utilize knowledge graphs more effectively:
1. **Graph Databases**: Popular graph databases like Apache Neo4j, Amazon Neptune, and Google’s JanusGraph provide the underlying infrastructure for creating, querying, and analyzing knowledge graphs.
2. **Data Wrangling Software**: Tools like Alteryx, Python libraries such as NetworkX, or specialized software for data integration (like Talend) can streamline data preparation for graph creation.
3. **Querying and Mining Software**: To tap into the full potential of your knowledge graph, utilize platforms that offer powerful querying capabilities, such as ArangoDB or GDS algorithms in Neo4j for advanced analytics.
4. **Visualization Tools**: Platforms like Tableau, Microsoft Power BI, or open-source solutions like Gephi help visualize knowledge graphs for easier understanding and sharing insights.
5. **AI and Machine Learning Libraries**: Libraries like TensorFlow or PyTorch can be employed to automate certain aspects of knowledge graph creation, such as entity recognition or relationship prediction.
### Conclusion
Knowledge graphs represent a significant leap forward in data management and analysis, offering unparalleled insights and decision-making capabilities. By leveraging these structures, organizations can unlock the true potential of their data assets, driving innovation, enhancing decision-making, and ultimately achieving competitive advantage in a data-driven world.
