Unlocking the Power of Knowledge Graphs: A Comprehensive Guide to Enhancing Data Intelligence and Decision-Making
In an era where data is abundant, making sense of this data and extracting value from it has become crucial for any organization aiming to remain competitive. Knowledge graphs serve as a pivotal tool in transforming raw data into actionable insights. They connect elements or entities within an organization, such as products, customers, suppliers, and processes, by establishing relationships between them. By doing so, knowledge graphs offer an enriched, interconnected view of data that can substantially enhance data intelligence and decision-making capabilities. This comprehensive guide aims to demystify knowledge graphs, explaining their unique value, functionalities, implementation strategies, and the benefits they bring to businesses across various domains.
### What are Knowledge Graphs?
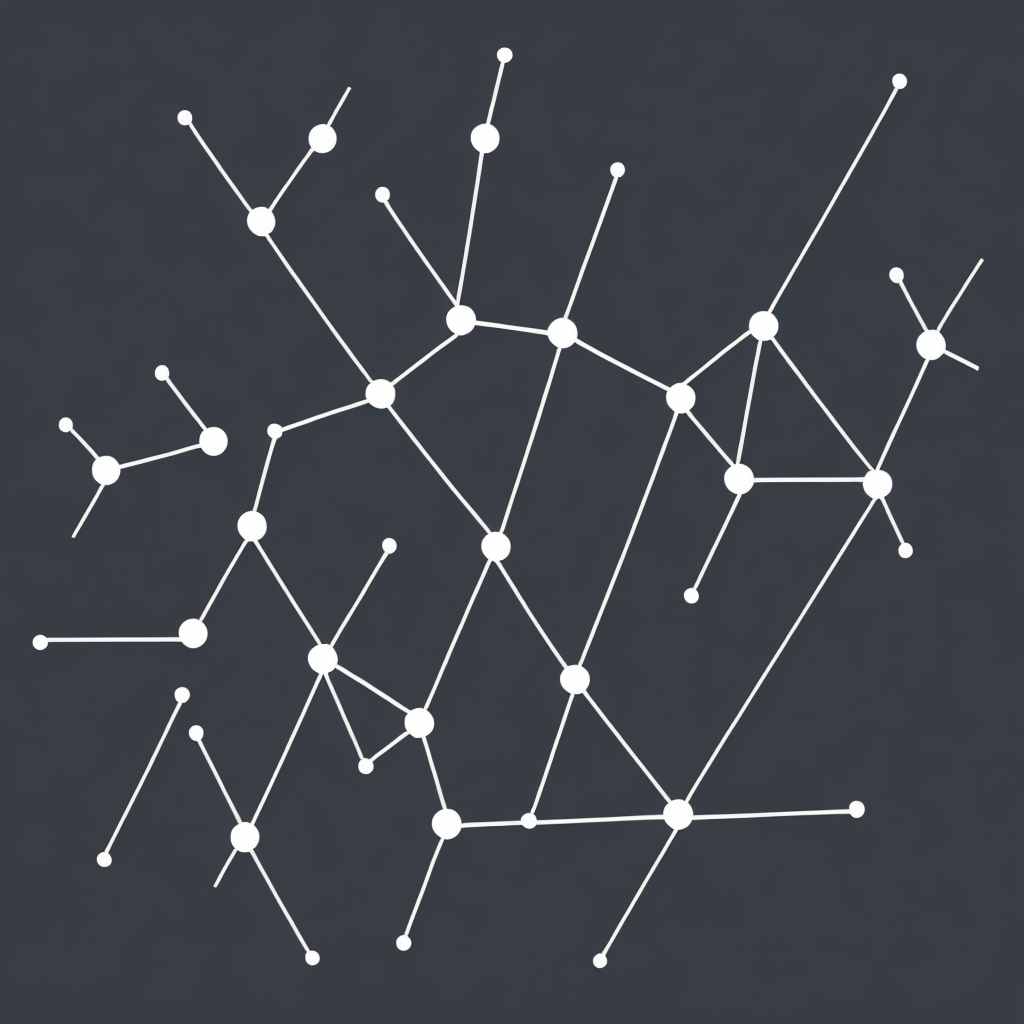
A knowledge graph is a type of graph database that represents real-world entities, concepts, and their relationships in a structured and connected format. Unlike traditional databases that primarily focus on data silos, knowledge graphs break down silos by highlighting the interconnections between various entities. This is achieved through nodes, representing the entities, and edges, representing the relationships between these entities. Knowledge graphs can be found in various applications, ranging from understanding the vast amounts of information on the internet to managing complex, interconnected data within an organization.
### Why Choose Knowledge Graphs?
1. **Enhanced Insight and Understanding**: Knowledge graphs provide a comprehensive view of interconnected data, facilitating a deeper understanding of complex systems, such as understanding customer journeys, identifying patterns, and making sense of the myriad connections between data elements.
2. **Improved Decision-Making**: By leveraging the insights gained from knowledge graphs, businesses can make data-driven decisions with confidence, ensuring that decisions are based on a complete and accurate view of the current landscape, which can lead to more effective outcomes.
3. **Increased Data Utilization**: Knowledge graphs make data more accessible and actionable. They ensure that all relevant data is connected and can be easily accessed, reducing redundancy and duplication, and helping to make the most of the data assets within an organization.
4. **Scalability and Flexibility**: Knowledge graphs are designed to scale and adapt to changing data landscapes. They are flexible enough to incorporate new types of data and update relationships in real-time, making them ideal for businesses dealing with rapid market changes and increasing data volumes.
### Implementing Knowledge Graphs
**Step 1: Define Objectives and Scope**
Start by identifying the specific business challenges you aim to address with the help of knowledge graphs. Determine the scope, focusing on the most critical data elements and their relationships.
**Step 2: Data Modeling**
Create a conceptual data model that outlines the entities, their attributes, and the relationships between them. This model forms the foundation of your knowledge graph.
**Step 3: Data Integration**
Gather and integrate data from various sources—structured and unstructured, internal and external—into your graph. Tools like knowledge graph platforms and data connectors can automate this process to ensure that your graph is rich and up-to-date.
**Step 4: Development and Deployment**
Develop the actual graph using suitable tools such as Apache TinkerPop, Neo4j, or Google’s Knowledge Graph Toolkit. Ensure that the graph is optimized for search, update, and retrieval operations.
**Step 5: Enrichment and Integration**
Continuously enrich the graph by adding new data and relationships. Integrate the knowledge graph into existing systems, such as CRM or BI tools, for seamless use in everyday decision-making processes.
**Step 6: Monitoring and Optimization**
Regularly monitor the performance and utility of the knowledge graph. Identify areas for improvement, such as adding new features, optimizing queries, or enhancing data quality, to keep the knowledge graph relevant and effective.
### Conclusion
In the era of big data, harnessing the power of knowledge graphs is essential for organizations looking to gain a competitive edge. By providing a structured, interconnected view of data, knowledge graphs unlock new insights, improve decision-making capabilities, and promote more efficient utilization of data assets. Implementing and optimizing a knowledge graph requires careful planning, continuous improvement, and a commitment to leveraging data-driven insights in the decision-making process. The investment in knowledge graph technology is, therefore, a wise choice for any organization committed to staying ahead in the fast-paced world of data intelligence.
