Unlocking the Power of Knowledge Graphs: A Comprehensive Guide to Enhancing Data Understanding and Decision Making
Knowledge graphs have emerged as a transformative technology in the world of data analytics and management, leveraging the interconnectedness of information to provide insights never before accessible. This article serves as an all-encompassing guide, dissecting the complex yet promising landscapes of knowledge graphs to demystify their power and demonstrate how they can significantly augment data understanding and decision-making processes.
### Understanding the Basics
Knowledge Graphs, at their core, are representations of structured knowledge. They consist of entities and their attributes, relationships between these entities, and the context in which they exist. Unlike traditional databases, which are primarily designed for transactional processing, knowledge graphs are built for exploratory querying and analytics, enabling businesses to navigate complex, interconnected data landscapes with ease.
### The Evolution of Knowledge Graphs
Knowledge graphs have evolved significantly over the past decade, driven by advancements in computational technology and the proliferation of big data. Initially, they were used primarily in academic research, but today, they empower applications across industries, including finance, healthcare, e-commerce, and social media analysis. This shift is largely due to the increasing availability of structured and unstructured data sources, facilitated by IoT devices, web scraping, and natural language processing algorithms.
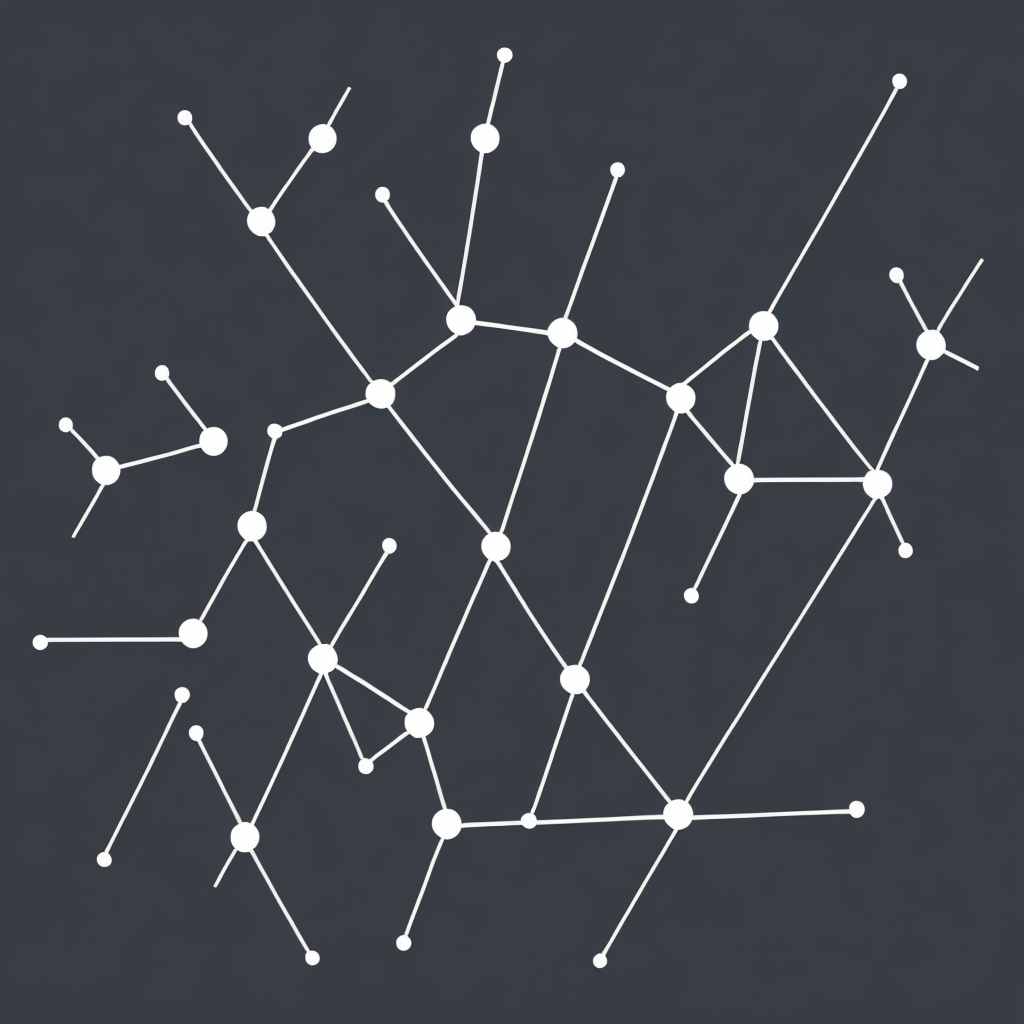
### Components of a Knowledge Graph
Knowledge graphs are typically composed of several key elements:
1. **Entities**: These are objects, concepts, or individuals that are represented as nodes within the graph. Each entity carries data or metadata that describes it.
2. **Relationships**: These are the connections or links between entities, often defined by specific types (e.g., is-a, has-a, etc.). Relationships illustrate the interactions, associations, or dependencies between entities.
3. **Attributes**: Attributes are properties or characteristics associated with entities that add depth to the graph. Attributes can be further categorized into categorical (nominal) and numerical (quantitative) types.
4. **Metadata**: Descriptive information about the entities, relationships, or attributes in the graph helps in maintaining its integrity and facilitating efficient querying.
### Applications and Use Cases
The versatility of knowledge graphs extends across a multitude of industry sectors and use cases:
– **Healthcare**: Knowledge graphs enable personalized medicine by connecting genomic variations, medical treatments, and patient outcomes, facilitating more informed medical decisions.
– **Finance**: Graphs help in compliance and fraud detection by mapping relationships between transactions, entities, and events, uncovering hidden patterns and anomalies.
– **Retail**: They improve customer experience through personalized product recommendations by understanding consumer behavior and preferences within a connected web of interactions.
– **Social Media Analytics**: Graphs provide insights into online communities, user relationships, and content spread, aiding in social media monitoring, influencer identification, and targeted advertising.
### Best Practices and Challenges
The effective utilization of knowledge graphs requires careful planning, data preparation, and integration. Best practices include:
– **Data Quality**: Ensuring the data is clean, accurate, and comprehensive is foundational to building reliable knowledge graphs.
– **Integration**: Combining internal and external data sources to enrich the graph with domain-specific knowledge.
– **Security**: Protecting sensitive data using encryption and access control mechanisms is non-negotiable in maintaining the integrity of the graph.
– **Scalability**: Designing the graph architecture and query optimization strategies to handle increased data volume and complexity effectively.
– **User Adoption**: Incorporating intuitive interfaces and tools to ease the process for non-technical users to query and utilize the graph.
### Conclusion
Knowledge graphs are powerful tools that unlock new dimensions of data discovery and decision-making. By fostering a structured, connected, and accessible representation of information, they offer unparalleled insights into complex domains. As technology advances and data complexity increases, the value of knowledge graphs will likely amplify, revolutionizing the way we organize, analyze, and derive meaning from data. Embracing knowledge graphs empowers organizations to move beyond traditional data management paradigms, towards a future where data-driven decisions are both informed and insightful.