Unlocking the Power of Knowledge Graphs: A Comprehensive Guide to Enhancing Data Understanding and Decision-Making
In the digital age, vast amounts of data are generated and collected daily, challenging data analysts, researchers, and businesses alike to harness meaning from it. Knowledge graphs, a form of interconnected data representation, have emerged as a powerful tool to facilitate this understanding. This article provides a comprehensive guide to unravel the intricacies and power of knowledge graphs in enhancing data understanding and decision-making processes.
### 1. **What are Knowledge Graphs?**
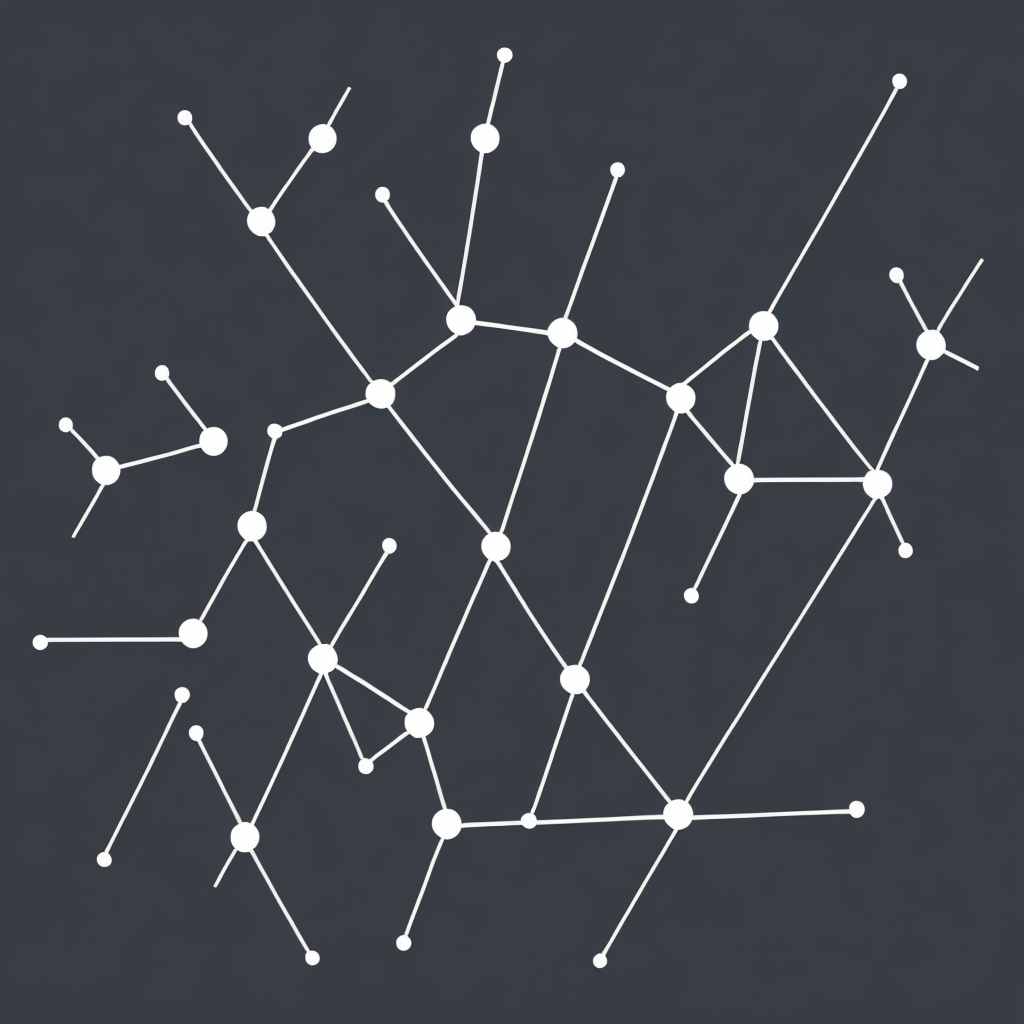
Knowledge graphs are structured datasets based on real-world concepts, their properties, and their relationships. They can be linked across multiple datasets, making them an incredibly versatile resource. At the core of knowledge graphs is the graph data model, where entities represent nodes and relationships between entities are represented as edges. This model allows for efficient querying and data mining across a wide domain, leading to insights that traditional relational databases and data warehouse models might overlook.
### 2. **Components of a Knowledge Graph**
A knowledge graph consists of three primary components:
– **Entities**: These are specific things, concepts, or objects of interest, such as people, places, products, or events.
– **Properties**: These are attributes associated with entities that describe their characteristics (e.g., name, birthdate, location, etc.).
– **Relationships**: These link entities to each other, representing real-world connections (e.g., “played for,” “is a type of,” “is located in”).
### 3. **Building Knowledge Graphs**
Building a knowledge graph involves several steps:
– **Data Collection**: Gather information from diverse sources, including structured databases, semi-structured data, and unstructured information like text and images.
– **Data Integration**: Merge data from different sources, ensuring consistency and reducing redundancy.
– **Entity Resolution**: Identify and standardize entities to avoid duplication and ensure accurate representation.
– **Schema Design**: Define how the graph should be structured, including entities, relationships, and properties.
– **Populating the Graph**: Insert data into the graph based on the defined schema.
– **Linking and Enrichment**: Establish connections between entities and enrich the graph through additional metadata or external services.
### 4. **Enabling Enhanced Data Understanding**
Knowledge graphs significantly enhance data understanding in several ways:
– **Improved Querying**: Allows for more natural and semantic queries, making it easier to extract relevant information.
– **Contextual Insights**: By linking entities and enriching data with contextual information, knowledge graphs provide deeper understanding and insights.
– **Decision Support**: Facilitates informed decision-making by integrating data from various sources, improving its relevance and accuracy.
– **Predictive Analytics**: Enables predictions and forecasting through the understanding of patterns and relationships within the data.
### 5. **Applications of Knowledge Graphs**
Knowledge graphs find applications in a multitude of sectors:
– **Healthcare**: For personalized healthcare, disease research, and clinical decision support.
– **Finance**: To detect fraud, manage risk, and improve customer experience.
– **E-commerce**: For product recommendations, understanding customer behavior, and inventory management.
– **Knowledge Management**: To create structured knowledge bases, facilitate learning, and support research.
### 6. **Challenges and Solutions**
While knowledge graphs offer immense benefits, they also present challenges such as data quality issues, computational complexity, and scalability. However, advancements in technologies like AI and NLP (Natural Language Processing) are helping mitigate these issues:
– **Data Quality**: Implementing better data validation processes, AI-driven data cleaning, and continuous monitoring systems for quality improvement.
– **Scalability**: Leveraging distributed computing frameworks and cloud resources to handle large datasets efficiently.
### 7. **Conclusion**
Knowledge graphs are powerful tools that revolutionize data management, understanding, and decision-making. They require thoughtful design, robust data handling, and continuous improvement based on evolving user needs and technologies. By harnessing the full potential of knowledge graphs, organizations can unlock deeper insights, improve operational efficiency, and drive innovation across various sectors.