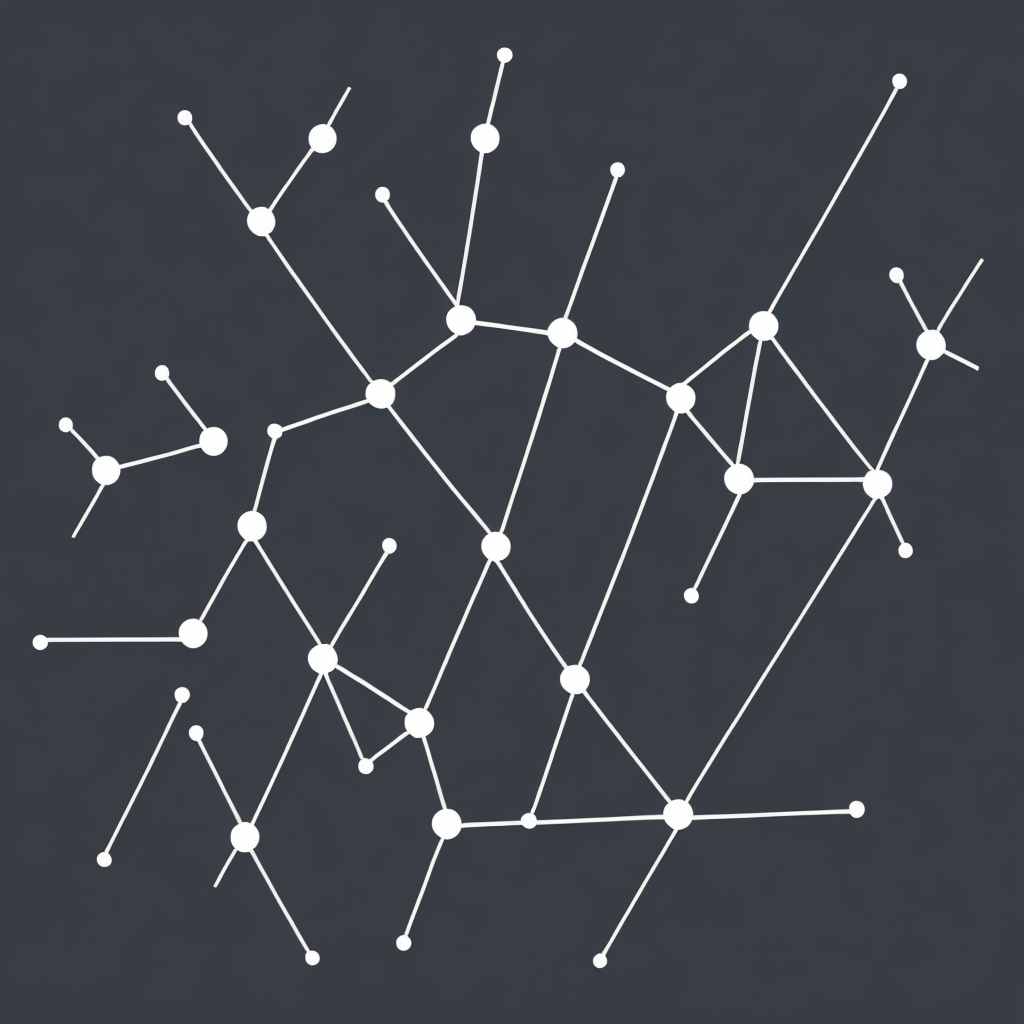
Unlocking the Power of Knowledge Graphs: Enhancing Information Retrieval, Data Integration, and Graphical Insights
In the era of big data, knowledge graphs stand as a powerful tool for businesses, researchers, and organizations alike. They represent a structured representation of data, with nodes symbolizing entities and edges representing relationships between these entities. Knowledge graphs transform raw data into valuable insights, enhancing information retrieval, data integration, and offering graphical perspectives in business decision-making, research, and customer experience.
**Enhancing Information Retrieval**
One of the primary benefits of knowledge graphs is their ability to enhance information retrieval. Traditional databases typically store data in flat tables, presenting challenges when managing large, interconnected datasets. In contrast, knowledge graphs store data in a schema-aware format, enabling them to handle complex, interconnected data seamlessly. They can perform semantic searches, asking specific types of questions not just based on key words, but on their semantic meaning. This can lead to highly relevant search results, offering insights that might not otherwise be found using simpler query methods.
**Improving Data Integration**
In the realm of data integration, knowledge graphs prove invaluable. With their ability to represent metadata and relationships in a structured manner, they facilitate a smoother and more efficient fusion of data from multiple sources. This amalgamation of data from various systems and formats allows for the creation of a cohesive, holistic view of an organization, which can be used to support strategic decision-making. Knowledge graphs are particularly adept at handling data from diverse formats, extracting meaningful connections and insights for users and applications that might not otherwise be apparent.
**Graphical Insights and Visual Analytics**
From a visual perspective, knowledge graphs offer unparalleled insights through their graphical representation. The visual depiction of nodes, edges, and attributes allows for a better understanding of complex relationships and patterns in the data. This graphical representation can aid in various ways:
1. **Insight Discovery**: It makes it easier to spot patterns and insights that might be hidden when looking solely at numerical data. This can be particularly useful in areas such as product recommendations, where the connections between different entities can reveal new opportunities.
2. **Process Optimization**: For businesses, visual analytics enable them to identify inefficiencies and redundancies in their processes. By mapping out the flow of data and resources, they can optimize operations and reduce costs.
3. **Enhanced Decision-Making**: Stakeholders gain a clearer picture of their organization, leading to better-informed decisions. Knowledge graphs aid in understanding consumer behavior, market trends, and potential opportunities, leading to strategies that are more targeted and effective.
**The Role of AI and Advanced Analytics**
The integration of artificial intelligence and advanced analytics with knowledge graphs elevates their capabilities even further. AI technologies can help in automatically extracting knowledge from unstructured data, enriching the graph with new insights. Advanced analytics, on the other hand, can automate the process of exploring and querying large knowledge graphs, providing dynamic and adaptable insights.
In conclusion, knowledge graphs are foundational to the digital transformation of modern organizations. By enhancing the way we retrieve, integrate, and analyze data, they are driving innovation in sectors ranging from healthcare to finance and beyond. As technology continues to evolve and integrate further with knowledge graphs, the potential for uncovering new insights and driving business value seems limitless.
