Unlocking the Power of Knowledge Graphs: Harnessing Structured Data for Enhanced Decision Making and Insights
In the era of Big Data, organizations grapple with the challenge of managing and extracting meaningful insights from vast troves of information. With the rapid proliferation of data, it has become increasingly imperative for businesses to leverage advanced analytical tools and techniques to derive intelligence from this data. One such powerful tool that has gained significant attention over the years is the knowledge graph. A knowledge graph represents complex relationships between entities by embedding and interconnecting structured data, thereby enabling organizations to unlock invaluable insights and drive enhanced decision-making processes.
### What Are Knowledge Graphs?
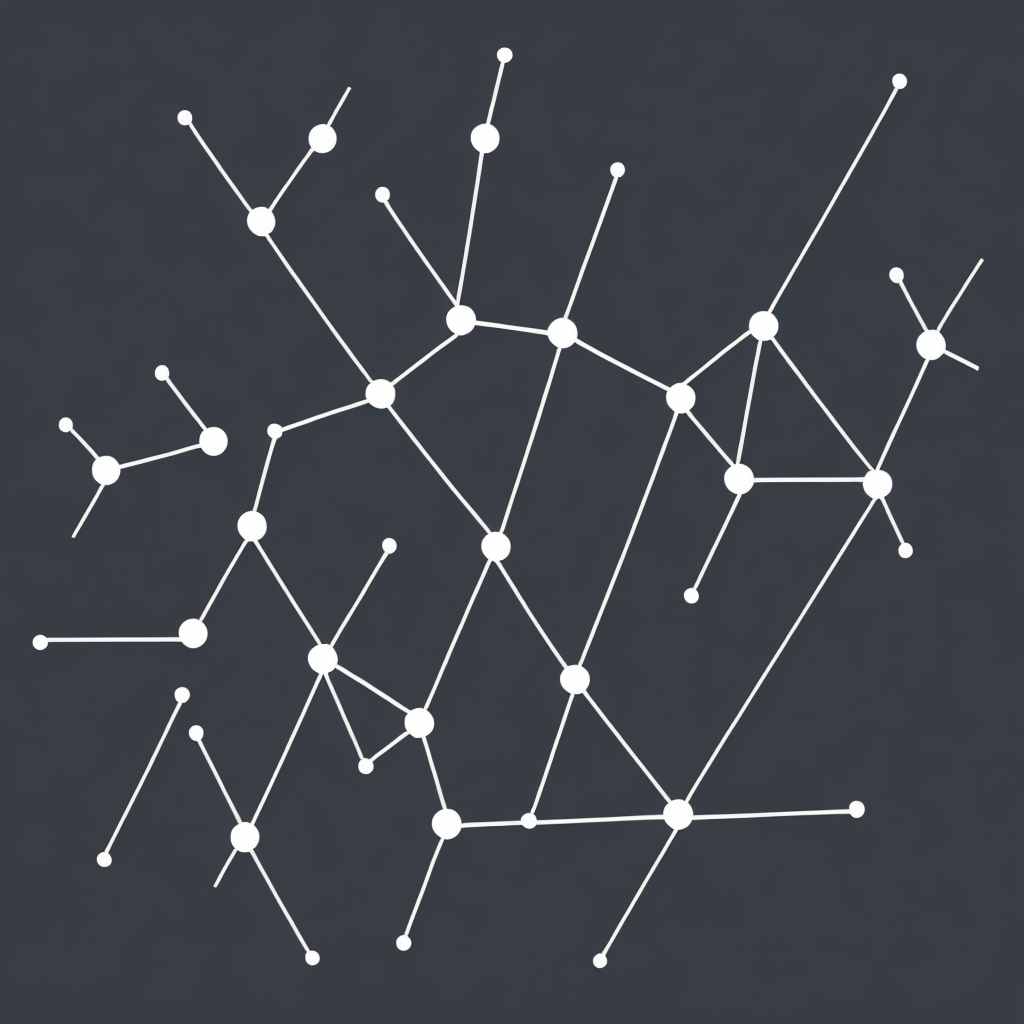
A knowledge graph is a semantic data model that maps entities of interest and their relationships, leveraging a highly structured and interconnected dataset. Unlike traditional relational databases or spreadsheets, which focus primarily on storing and retrieving data, knowledge graphs are designed to represent and reason about complex data relationships. They typically utilize a type of structured data called “linked data” which allows for the sharing and interlinking of data across various domains and platforms.
### The Power of Knowledge Graphs
The power of knowledge graphs lies in their ability to uncover hidden relationships, patterns, and insights from structured data. By connecting diverse data elements, knowledge graphs facilitate a more holistic understanding of business processes, customer behavior, and operational efficiencies. This, in turn, drives informed decision-making across various functional areas of an organization including product development, marketing, sales, and customer service, as well as strategic planning and risk management.
#### 1. **Enhanced Decision-Making**
Knowledge graphs improve decision-making by providing a comprehensive view of interconnected data. For instance, in the realm of product development, a knowledge graph can help identify trends, understand consumer preferences, and optimize product designs based on historical data and real-time insights. Companies can leverage these insights to adapt quickly to market changes, prioritize product enhancements, and increase customer satisfaction.
#### 2. **Improved Customer Insights**
By interlinking data from various sources such as transaction records, customer preferences, and social media interactions, knowledge graphs can create a detailed profile of each customer. This granular understanding enables more personalized marketing strategies, improved targeting, and customized product offerings, ultimately leading to higher customer engagement and loyalty.
#### 3. **Operational Efficiency**
Incorporating a knowledge graph into operational workflows can automate tasks, reduce redundant processes, and optimize resource allocation. For example, through predictive maintenance, a knowledge graph can predict equipment failures based on historical data, allowing for proactive maintenance and minimizing downtime. This leads to decreased operational costs and increased productivity.
#### 4. **Risk Management**
Knowledge graphs can help organizations identify and mitigate risks by visualizing potential threats and vulnerabilities through connected data patterns. In financial services, for instance, a knowledge graph might be used to detect fraudulent activities by identifying unusual patterns in transaction data or by linking and analyzing online behaviors.
### Building and Implementing Knowledge Graphs
### 1. **Data Preparation**
The process begins with curation and integration of diverse data sources. It is crucial to standardize and clean the data to ensure consistency, completeness, and accuracy. This may involve extracting structured data from CSV files, JSON, or relational databases, and converting it into a format that can easily be linked within the knowledge graph.
### 2. **Graph Creation**
Tools such as RDF (Resource Description Framework), SPARQL (SPARQL Protocol and RDF Query Language), and various graph databases like Neo4j or Apache TinkerPop are commonly used for creating, storing, and querying data in a knowledge graph. The design phase involves creating nodes (representing entities) and edges (representing relationships) to map out the data landscape.
### 3. **Integration and Updating**
Regularly updating the knowledge graph ensures that it remains up-to-date with the latest data and insights. Integrating new sources of data and periodically cleansing and refreshing existing data are key components of this process.
### 4. **Analytics and Applications**
Leveraging the graph for insights involves querying the data for specific relationships, patterns, or trends. Advanced analytics tools and AI can be integrated to perform sophisticated analyses, predict outcomes, and identify new opportunities.
### Conclusion
In conclusion, knowledge graphs are powerful tools that can revolutionize decision-making processes by unlocking insights buried within structured data. From enhancing operational efficiencies and improving customer interactions to providing strategic business insights and optimizing risk management, the potential improvements are vast and can significantly contribute to an organization’s growth and success. As such, the adoption and integration of knowledge graphs should be seen as a strategic priority for businesses aiming to stay competitive in today’s data-driven world.
