The Power of Knowledge Graphs: Navigating the Intertwined Web of Data and Information
In the vast landscape of digital information, knowledge graphs emerge as a navigational beacon, guiding us through the complex network of facts, objects, and relationships that constitutes our digitized world. Born out of the confluence of graph theory, data science, and artificial intelligence, knowledge graphs represent the power to transform unstructured data into a structured network of knowledge, making it more accessible, understandable, and applicable.
### Structure and Function
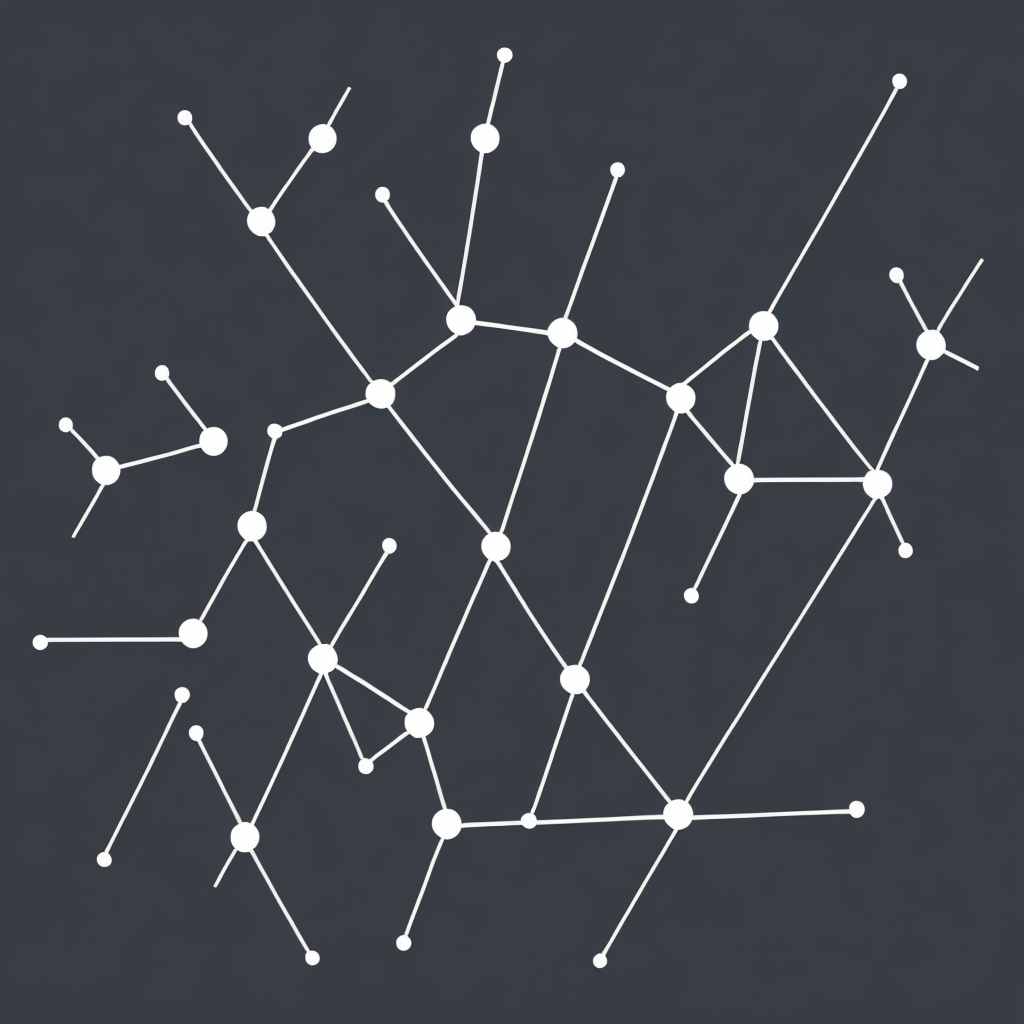
Knowledge graphs, fundamentally, are databases organized in a graph-like structure. Unlike traditional databases that store data in rows and columns, knowledge graphs use nodes to represent objects (such as entities and concepts) and edges to denote the relationships between these nodes. This approach allows for the depiction of intricate, interconnected knowledge in a visually intuitive and logically coherent manner.
### Key Components
– **Nodes**: Typically, these represent the entities in the data such as persons, places, events, and concepts.
– **Edges**: These illustrate the relationships between nodes, whether they describe attributes, properties, or connections between entities.
– **Triples**: Commonly used in knowledge graph construction, triples consist of subject, predicate, and object, effectively encapsulating the essence of a piece of information.
### The Impact on Information Management
Knowledge graphs address several challenges in information management by:
– **Enhanced Data Integration**: They enable the consolidation of data from diverse sources into coherent and unified views, facilitating easier integration and reuse of data.
– **More Relevant Search**: By understanding the semantic relationships within the dataset, knowledge graphs allow for more accurate and contextually relevant search results and recommendations.
– **Predictive Insights**: They enhance the ability to derive insights from data by uncovering patterns and making predictions that are not immediately apparent.
– **Personalization**: Knowledge graphs are increasingly being used to tailor experiences and information delivery, personalizing content and recommendations for users based on their preferences and context.
### Applications in Various Domains
Across various industries, knowledge graphs have revealed immense potential:
– **Healthcare**: By mapping out relationships between diseases, symptoms, medications, and treatments, knowledge graphs empower more targeted and effective patient care.
– **Retail**: They enable personalized shopping experiences by analyzing customer behavior, preferences, and trends, leading to smarter inventory management and product recommendations.
– **Financial Services**: Knowledge graphs support risk assessment, fraud detection, and compliance by providing deep insights into relationships between entities and transactions.
– **Research and Development**: In academia and scientific research, knowledge graphs facilitate the discovery of new knowledge and potential collaborations by mapping out connections between theories, data sets, and researchers.
### Conclusion
The power of knowledge graphs lies in their ability to unveil the underlying structure and relationships in complex data, turning it into a navigable, understandable, and actionable form. As we continue to generate and manage increasingly voluminous datasets, the importance of knowledge graphs in unlocking the potential of data as a strategic asset becomes more pronounced. By leveraging their capabilities, organizations can drive innovation, improve operational efficiency, and unlock new opportunities for growth and discovery.