Unlocking the Power of Knowledge Graphs: Navigating the Semantic Web for Enhanced Data Understanding and Decision Making Knowledge graphs—complex structures that organize and interconnect vast amounts of data—serve as invaluable tools for businesses, governments, academic institutions, and a wide range of organizations in their quest to understand, utilize, and harness the power hidden within their data. By exploring the intricacies of knowledge graphs, we can navigate the semantic web more effectively, facilitate better decision-making, and uncover valuable insights that drive growth, innovation, and success in various sectors.
### What Are Knowledge Graphs?
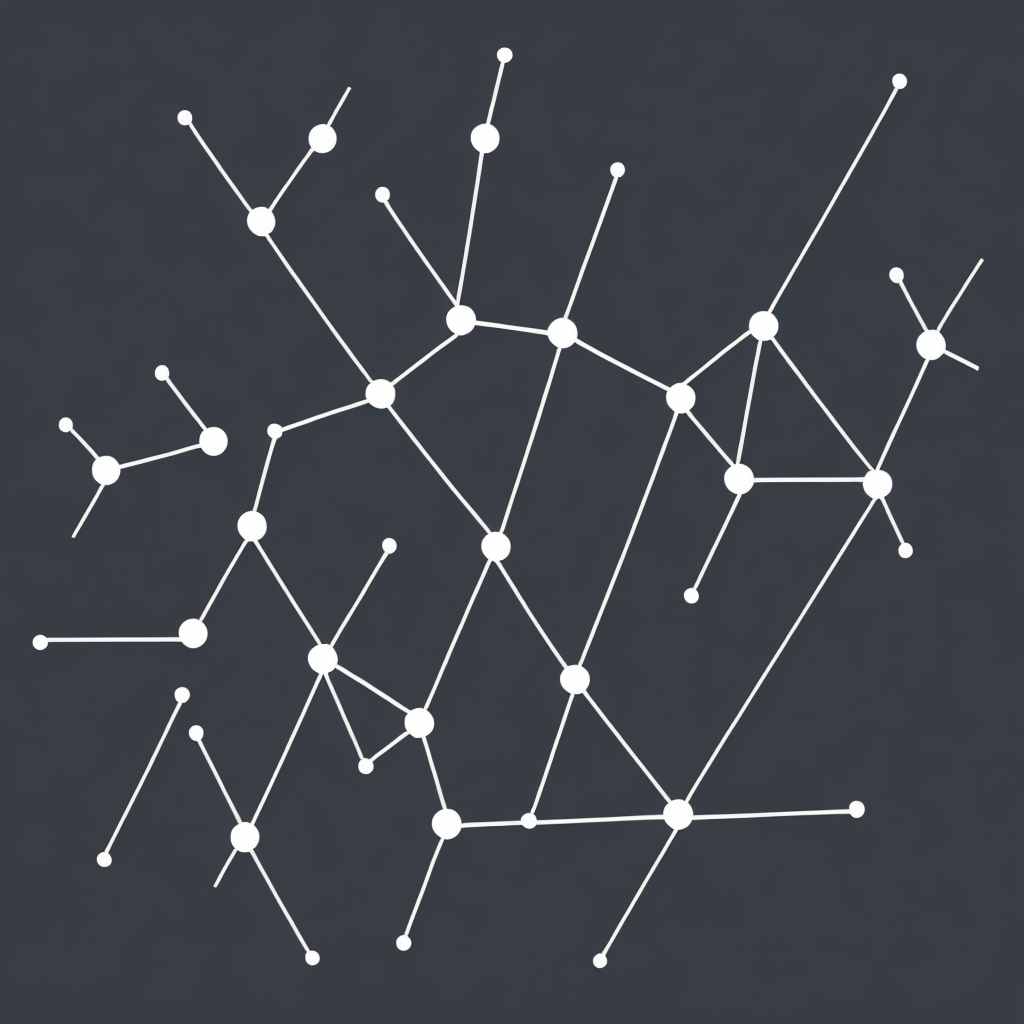
At the heart of knowledge graphs lies the concept of interconnected data. These graphs consist of nodes representing concepts or entities, connected by edges or links that denote relationships between these entities. Knowledge graphs can exist in various forms, such as semantic networks or RDF (Resource Description Framework) datasets, allowing them to encompass a wide array of information across different domains.
### Benefits of Knowledge Graphs:
#### Enhanced Data Understanding
One of the primary advantages of knowledge graphs is the ability to see the relationships between data points. This interconnected view enables users to understand complex information in a more holistic and intuitive way. For example, a knowledge graph can make it easier to grasp how a particular policy impacts different industries, how changes in economic indicators affect consumer behavior, or how new regulations might influence the performance of various companies in a market.
#### Improved Decision Making
Knowledge graphs aid decision makers by providing deeper insights and context. By presenting information in a structured and interconnected format, knowledge graphs allow users to analyze data from multiple angles, facilitating more informed and strategic choices. This is particularly useful in scenarios requiring nuanced judgments, such as financial risk assessment, strategic planning, or policy development.
#### Predictive Insights
Knowledge graphs can predict trends and outcomes based on historical data and its connections. This predictive capability is crucial in fields like finance, healthcare, and retail, where understanding future possibilities allows for proactive strategies, personalized customer experiences, and more effective interventions.
#### Multi-Domain Integration
As knowledge graphs are essentially a connected web, they allow for seamless integration of information from various domains. This is beneficial in sectors like social media analysis, where context matters more than the content alone, or in scientific research, where interdisciplinary knowledge can be crucial for groundbreaking discoveries.
### Technologies and Tools for Knowledge Graphs
To fully leverage the power of knowledge graphs, various technologies and tools are employed, including:
– **Knowledge Representation and Reasoning Platforms**: Tools like Freebase, DBpedia, RDFLib (Python), and Virtuoso (OpenSource SPARQL Server and integrated development environment) enable the creation, querying, and management of knowledge graphs.
– **Graph Databases**: Databases like Neo4j, Amazon Neptune, and Google’s JanusGraph offer performance optimizations for large-scale graph data, allowing for efficient querying and analytics on complex graphs.
– **Machine Learning and AI**: Integrating knowledge graph data with AI tools enhances the system’s ability to learn from patterns, improve predictions, and execute tasks autonomously. TensorFlow, PyTorch, and DL4J (DeepLearning4J) are popular frameworks that can work with structured data from knowledge graphs.
### Implementing a Knowledge Graph
Creating a knowledge graph involves several key steps:
1. **Data Acquisition**: Gather data from various sources, ensuring that the data is relevant, reliable, and properly formatted.
2. **Data Preparation**: Clean the data, eliminating duplicates, errors, and irrelevant information. Transform the data to make it compatible with the graph schema.
3. **Schema Definition**: Decide on the properties and relationships that will form the graph structure. This includes determining how entities relate to each other and the attributes that entities possess.
4. **Data Population**: Populate the graph with data, either manually or via automated tools. This step might involve mapping existing silos of data into the graph format.
5. **Querying and Analysis**: Utilize the graph for querying and analysis. Develop algorithms and queries to extract meaningful insights from the interconnected data.
6. **Visualization**: Visualize the relationships in the graph to help stakeholders understand the interconnected data more intuitively.
### Conclusion
In today’s data-driven world, organizations must harness the power of knowledge graphs to navigate the semantic web effectively. By enhancing data understanding, improving decision-making, offering predictive insights, and integrating information from diverse domains, knowledge graphs represent a future-forward approach to data management and analysis. This technology empowers organizations to unlock hidden value, make informed decisions, and unlock new strategic landscapes through the exploration of interconnected data. Embracing knowledge graphs is, thus, not merely a choice but a necessity in the era of big data and complex information ecosystems.
