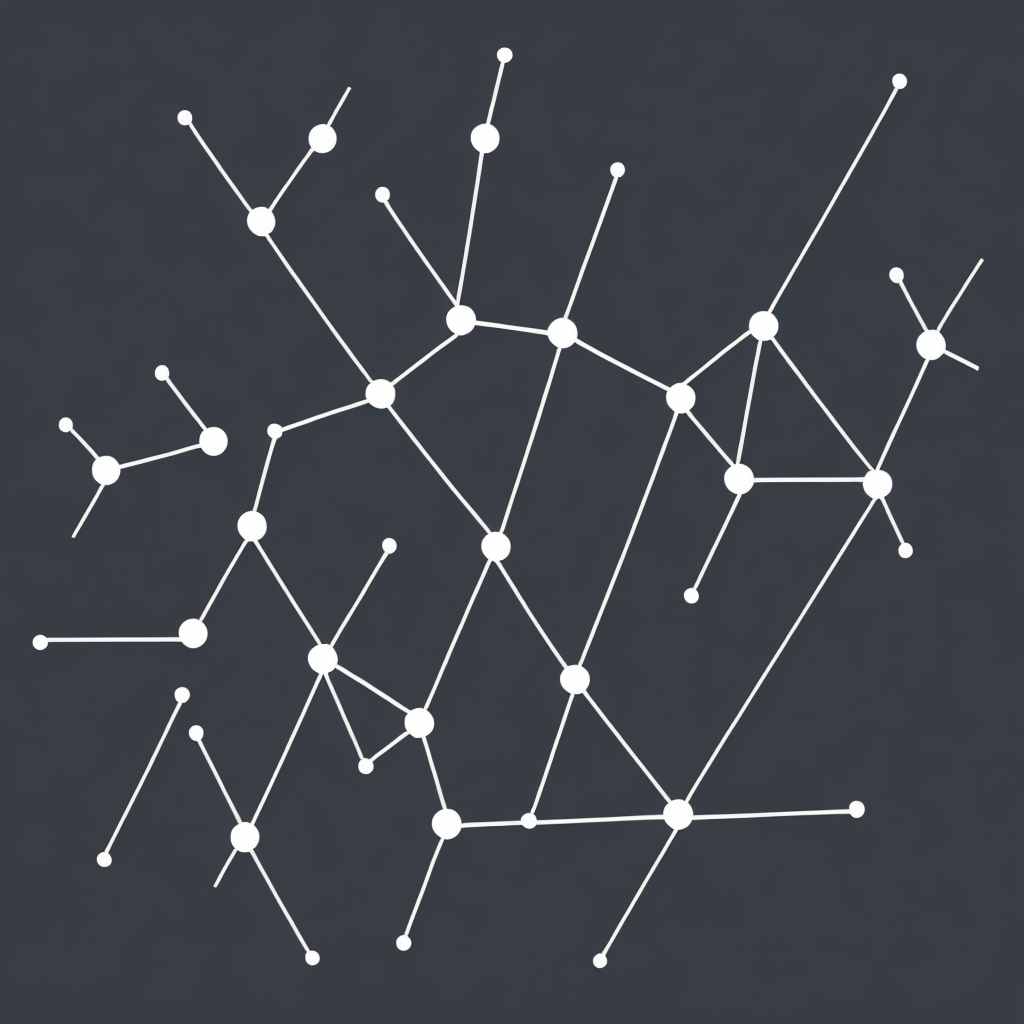
In the realm of data-driven analytics, knowledge graphs emerge as a robust and sophisticated tool for unlocking the full potential of information. Combining the power of graph theory with modern database management systems, these structures enable organizations to harness personalized insights and enhance decision-making processes in a multitude of industries. From healthcare to financial services, and e-commerce to digital marketing, knowledge graphs serve as the cornerstone of personalized and intelligent solutions.
### What Are Knowledge Graphs?
Knowledge graphs are digital representations of real-world entities and the relationships between them. Unlike traditional databases that emphasize structured data, knowledge graphs excel at incorporating and connecting diverse forms of data, including unstructured elements such as text, images, and videos. They are designed to model complex, interconnected data structures, akin to mapping the intricate web of relationships within a knowledge domain.
### Building Blocks of Knowledge Graphs
#### 1. **Entities**: These are the fundamental components representing real-world objects or concepts. For instance, in a library knowledge graph, entities could include books, authors, and publishers.
#### 2. **Properties**: Properties link entities and define their characteristics or attributes. In our library analogy, properties might include the publication year of a book or the number of pages.
#### 3. **Relationships**: These represent the connections between entities. For example, in the library knowledge graph, a relationship could be “author-of” between an author entity and a book entity.
#### 4. **Constraints**: Ensuring data consistency and integrity, constraints are imposed to govern the structure and relationships within the graph. Ensuring that entities such as authors are distinct from books they authored.
### Benefits for Personalized Insights
#### **Enhanced Data Analysis**
Knowledge graphs provide a more nuanced understanding of data by highlighting patterns and connections that might be obscured in traditional data models. This analysis can help uncover insights into user behavior, preferences, and patterns that lead to more effective personalization.
#### **Customized Content Recommendations**
In e-commerce and digital media, knowledge graphs enable the recommendation of products or content tailored to individual users. By understanding a user’s preferences and behaviors across various platforms, businesses can deliver personalized experiences and products that match the user’s interests more accurately.
#### **Improved Decision Support**
In sectors like finance and healthcare, decision-making often relies on complex data analysis. Knowledge graphs can integrate vast repositories of structured and unstructured data, facilitating more informed decision-making processes. This is crucial in predicting market trends, disease outbreaks, or risk assessments in insurance.
### Example Use Cases
**Healthcare**: Knowledge graphs can integrate patient data, medical history, and drug interactions to provide doctors with a holistic view of patient health, leading to more personalized treatment plans.
**Financial Services**: In anti-fraud systems, knowledge graphs can map connections between various financial transactions, recognizing patterns that indicate potential fraudulent activities.
**Marketing**: By analyzing consumer behavior across multiple channels, marketers can create more targeted and efficient campaigns.
### Conclusion
Knowledge graphs represent a significant advancement in data management and analysis, offering the power to transform how businesses leverage their information assets for better insights and decision-making. As the digital landscape grows ever more complex, the ability to build and maintain knowledge graphs becomes indispensable in driving innovation and personalization. Whether you’re streamlining a healthcare protocol, recommending personalized products, or enhancing risk assessment in finance, the application of knowledge graphs promises to revolutionize how organizations operate, optimizing processes and outcomes through the power of data interconnectedness.
