Unlocking the Hidden Value: The Power of Knowledge Graphs in Enhancing Data Interpretation and Decision Making
Knowledge graphs hold immense promise in unlocking the hidden value in vast data sets. As data volumes continue to grow exponentially, the ability to make sense of these data sets, derive insights, and make informed decisions becomes increasingly essential. Traditional data analytics methods often struggle to provide a comprehensive picture of how different data points and variables relate to one another. Knowledge graphs, on the other hand, allow for better data interpretation by creating a more structured and interconnected representation of data, thereby enhancing our understanding of complex relationships and driving more impactful decision making.
### 1. Representing Data in a More Meaningful Way
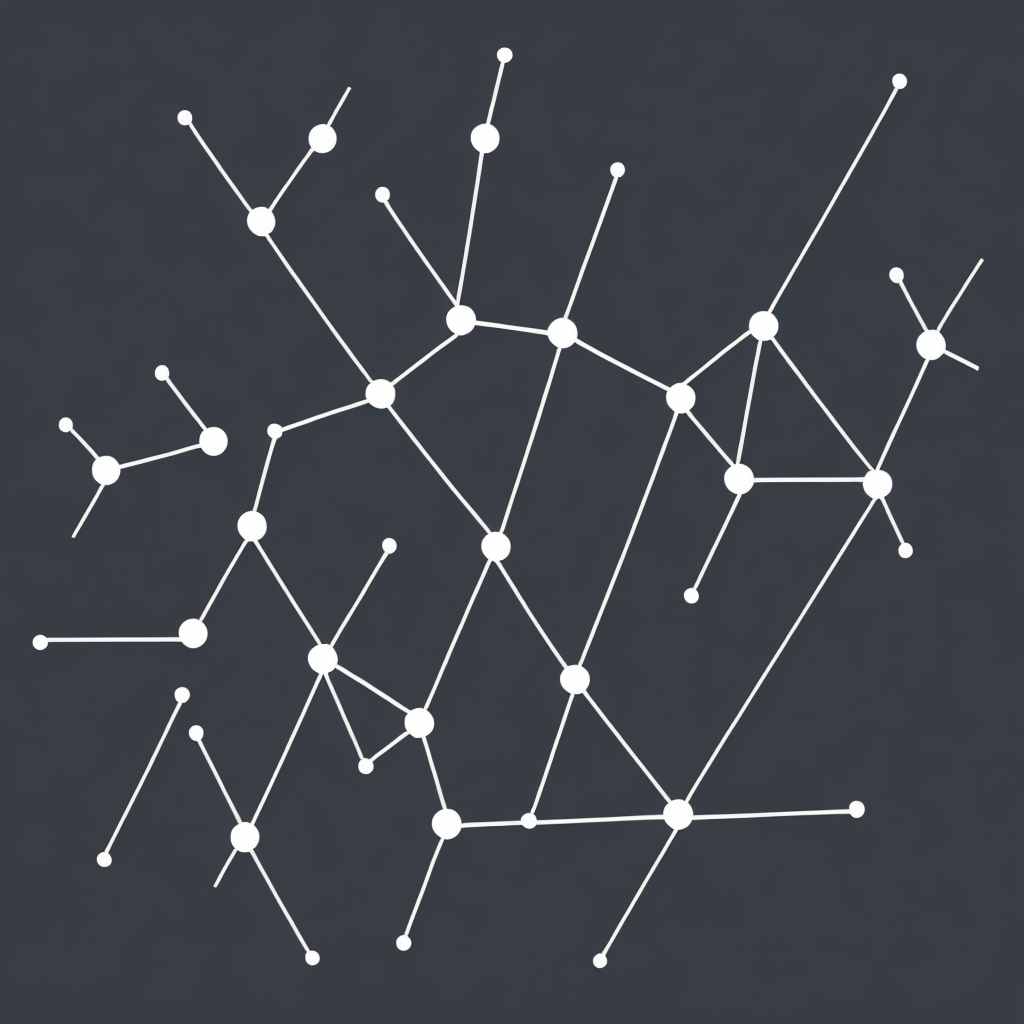
Knowledge graphs store data in a highly structured format, using nodes (entities) and edges (relationships) to represent data. For example, in a knowledge graph about movies, nodes might include actors, directors, genres, or characters, while edges could signify relationships such as “acted in” or “belongs to.” This structure makes it possible to connect seemingly disparate pieces of information and identify patterns and insights that were not previously evident.
### 2. Enhancing Understanding Across Domains
By integrating data from multiple sources and domains, knowledge graphs enable a holistic view of complex systems. In healthcare, for instance, a knowledge graph can link patient records, clinical trials, medical literature, and genetic data. This interconnected view can help researchers identify new connections between diseases and treatments, accelerate drug discovery, and improve personalized medicine.
### 3. Improving Predictive Analytics
Knowledge graphs can significantly boost the accuracy and reliability of predictive analytics. By understanding the relationships between variables and incorporating historical context, these graphs help in predicting future trends more accurately. In financial services, this could mean better risk assessment, fraud detection, and investment strategies.
### 4. Supporting Decision Making with Rich Context
Knowledge graphs provide context-rich insights that enrich decision making at various levels of an organization. For example, in marketing, a knowledge graph could analyze customer behavior across various touchpoints, from social media interactions to purchasing history. This detailed understanding allows for more targeted and effective marketing strategies and customer engagement efforts.
### 5. Facilitating Cross-functional Collaboration
With a centralized, comprehensive view of the organization’s data landscape, knowledge graphs facilitate collaboration between departments by breaking down silos. Teams across the business can access and utilize a unified, up-to-date, and integrated set of data, fostering better alignment and coordination on strategic initiatives.
### 6. Enhancing Data Security and Privacy
As data is structured in a knowledge graph, it becomes easier to manage and secure, given the controlled access to data. The ability to define and limit who can access certain nodes and edges ensures that sensitive information remains protected while still allowing for the necessary insights within a secure and compliant framework.
### Summary
In conclusion, the power of knowledge graphs lies in their ability to transform raw data into meaningful, interconnected insights. By enhancing data interpretation, improving predictive analytics, supporting robust decision making, promoting cross-functional collaboration, and enhancing data security, knowledge graphs unlock value across diverse industries and applications. As such, embracing knowledge graphs as a strategic tool can be pivotal in maximizing the potential of Big Data and driving innovation and efficiency in modern organizations.
