Unlocking the Power of Knowledge Graphs: A Comprehensive Guide to Enhancing Data Management and Decision Making
In today’s digital age, organizations are drowning in a sea of voluminous data. Managing, analyzing, and making sense of this data remain significant challenges for enterprises seeking to leverage it for decision making, enhancing business processes, and gaining competitive advantages. Knowledge graphs – relational representation models of information – have emerged as powerful tools for optimizing data management, enriching insights, and ultimately driving better decision making. This comprehensive guide introduces knowledge graphs, their importance, implementation, and key benefits, offering a roadmap for organizations aiming to unlock the full potential of their data.
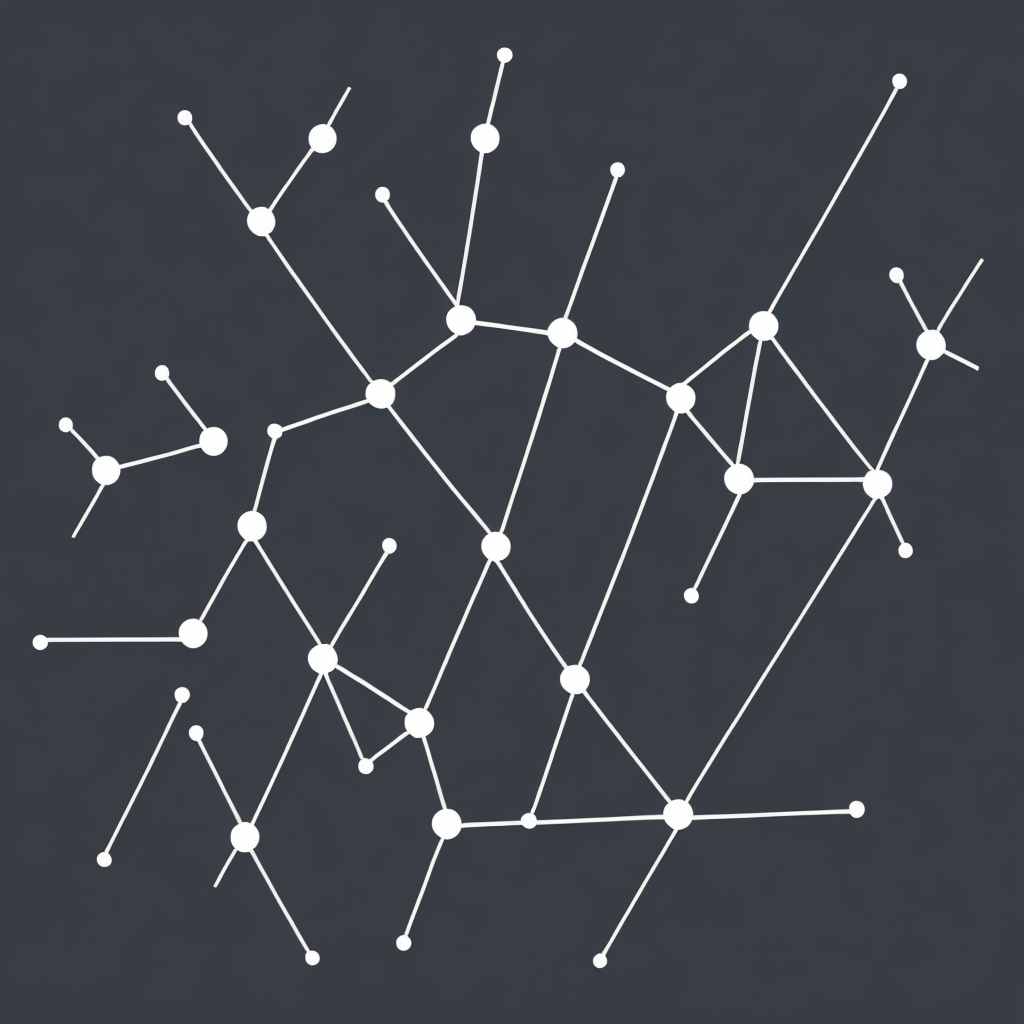
## What Are Knowledge Graphs?
Knowledge graphs represent data as a network of entities, concepts, and their interrelationships, using nodes (representing entities or concepts) and edges (representing relationships between these entities). This structured representation allows for the modeling of complex, intertwined relationships within data, facilitating deeper insights and enabling advanced querying capabilities.
## Understanding the Components
– **Nodes**: Components of the graph that represent various objects or entities. These could be anything from people, places, organizations, or items.
– **Edges**: Connect nodes and denote relationships, such as “is a part of,” “employs,” “produces,” “is located in,” among others.
– **Attributes and Properties**: Additional details associated with nodes or edges to provide context and specificity.
## Architecture of Knowledge Graphs
Effective knowledge graphs typically consist of four key components:
1. **Data Source Aggregation**: Merging information from various sources to build a comprehensive and up-to-date dataset.
2. **Curation and Deduplication**: Ensuring the quality and accuracy of the data, removing duplicates, and filling in missing information.
3. **Graph Construction**: Mapping data relationships, creating nodes, edges, and attributes.
4. **Querying and Analysis**: Utilizing sophisticated algorithms to answer queries, identify patterns, and facilitate decision-making processes.
## Implementation Steps
### 1. Define Objectives and Scope
Begin by identifying goals, specifying the types of relationships you need to model, and determining the data sources that will provide the most valuable insights.
### 2. Gather and Prepare Data
Source data from various databases, APIs, and external repositories, ensuring you have the rights and permissions to use it. Apply data cleaning, integration, and deduplication techniques.
### 3. Construct the Graph
Formulate nodes and edges based on your data, using appropriate ontologies and schema definitions. This involves creating rules for how entities and relationships connect within your graph.
### 4. Enhance with External Knowledge
Integrate additional datasets from trusted sources to enrich your graph with more context and depth. Consider community ontologies or linked data resources.
### 5. Deploy and Optimize
Integrate the knowledge graph into relevant systems and applications, ensuring security, performance, and scalability. Continuously monitor and refine the graph based on usage patterns and evolving business needs.
### 6. Utilize for Decision Support
Apply querying and visualization tools to explore data, identify trends, and inform critical business decisions. This can include predicting outcomes, personalizing user experiences, or optimizing processes.
## Key Benefits of Knowledge Graphs
– **Enhanced Data Integration**: Facilitates better linkage between data systems, reducing data silos.
– **Improved Decision Making**: Provides insights that go beyond the surface level, enabling more informed and strategic choices.
– **Increased Intelligence**: Supports automated reasoning and predictive analytics, improving operational efficiency.
– **Personalization**: Enables tailored experiences for users or customers through better understanding of their needs and preferences.
– **Risk Mitigation**: Helps identify vulnerabilities and threats by uncovering interlinkages between seemingly unrelated data points.
## Conclusion
Knowledge graphs are transformative technologies that offer unparalleled capabilities in managing complex data ecosystems. By unlocking the power of these structures, organizations can gain competitive advantages through smarter, faster decision making that drives innovation and growth. As the volume and complexity of data increase, the value of a well-constructed knowledge graph only continues to grow, cementing its place as an essential tool in the modern data-driven world.