Unlocking the Power of Knowledge Graphs: A Comprehensive Guide to Enhancing Data Understanding and Utilization
In the vast and complex world of data, organizations face the immense challenge of making sense of the massive volumes of information that often come disorganized and fragmented. This is where knowledge graphs step into the picture as game-changers, revolutionizing how data is understood and utilized. By weaving together datasets with relationships and attributes, knowledge graphs reveal connections that are not only enlightening but also invaluable for driving insights, enhancing decision-making, and fostering innovative use cases. This guide will delve into the core aspects of knowledge graphs, explaining their benefits, providing practical insights, and highlighting real-world applications.
### Understanding Knowledge Graphs
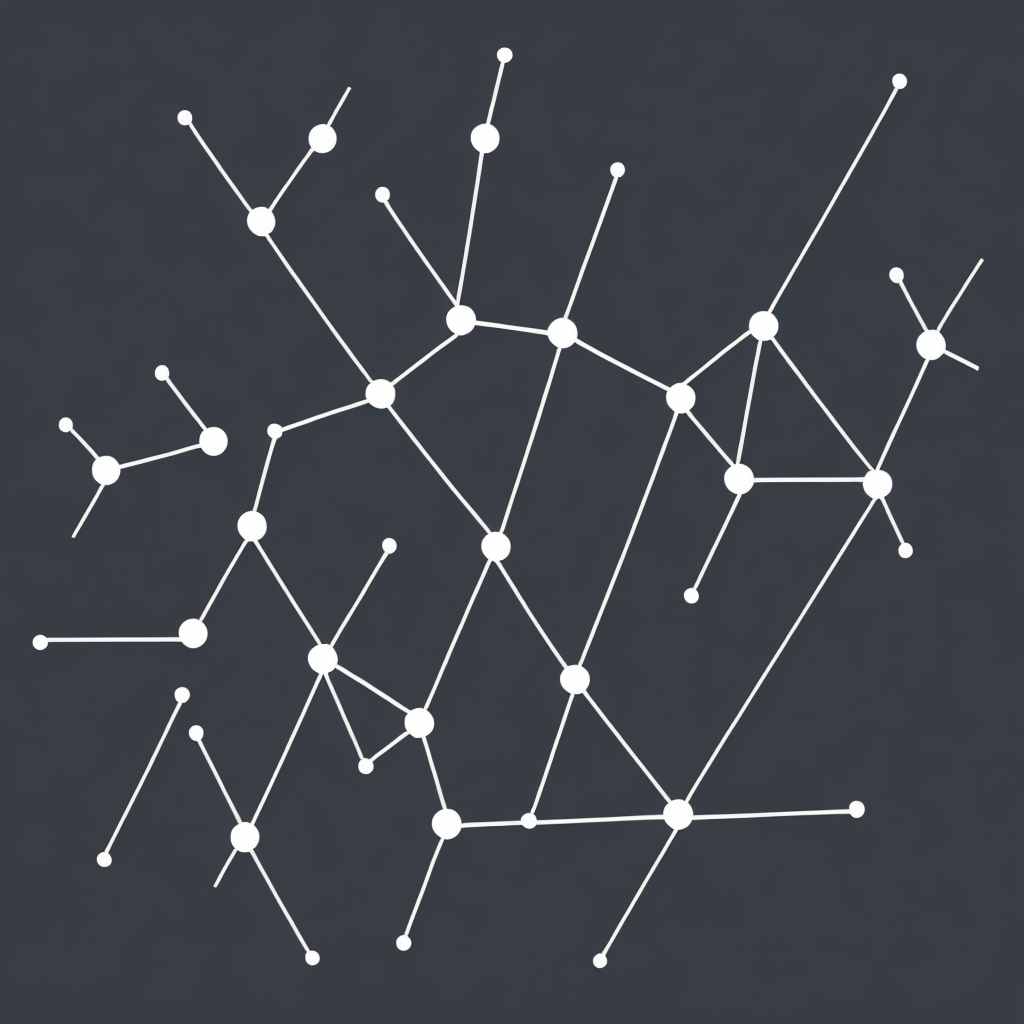
At their core, knowledge graphs are digital representations of real-world entities and their relationships. They are structured like a web, where each node represents an entity (such as a person, company, location, or product), and each edge signifies a relationship between these entities. These relationships can be as simple as ‘was born in’ for a person or as complex as a multi-layered connection such as ‘produced’, ‘was influenced by’, or ‘is similar to’. By providing a clear, interconnected map of relationships, knowledge graphs help to:
– **Enhance Data Context:** By illustrating how different pieces of information are interconnected, knowledge graphs help users understand the broader context of data, enhancing their ability to draw meaningful insights.
– **Improve Query Efficiency:** Knowledge graphs optimize search capabilities, allowing users to navigate through vast datasets more efficiently and uncover previously hidden relationships.
– **Support Decision Making:** With a clear visualization of how entities relate to one another, knowledge graphs aid in making informed decisions by presenting a holistic view of the landscape.
### Benefits of Knowledge Graphs
1. **Enhanced Data Unification:** Knowledge graphs integrate, unify, and simplify access to data from various silos, providing a one-stop-shop solution for information management.
2. **Streamlined Analytics:** By modeling data in a structured way, knowledge graphs enable more effective data analytics, facilitating the extraction of insights and patterns that traditional analytics might miss.
3. **Enhanced User Experience:** In applications like search engines or recommendation systems, knowledge graphs can significantly improve user experience by providing contextually relevant information and personalized recommendations.
### Real-World Applications
– **Healthcare:** Knowledge graphs can be used to map relationships between diseases, symptoms, treatments, and patient outcomes, aiding in personalized medicine by identifying unique patient profiles and potential treatment options.
– **Financial Services:** In finance, knowledge graphs help in detecting fraudulent activities by identifying patterns of transactions and connections between entities such as individuals, accounts, and locations.
– **Retail:** Retail businesses leverage knowledge graphs to develop sophisticated recommendation engines, enhancing customer experience by offering personalized product suggestions based on shopping patterns and preferences.
### How to Implement Knowledge Graphs
Implementing knowledge graphs involves several key steps:
1. **Data Integration:** Start by gathering and integrating diverse datasets, ensuring data quality and consistency.
2. **Schema Design:** Develop a logical structure for your knowledge graph, defining entities, relations, and attributes.
3. **Relationship Mapping:** Populate the graph by creating nodes (entities) and edges (relationships) that accurately reflect real-world connections.
4. **Querying and Analysis:** Utilize specialized tools and query languages to extract insights, optimize decision-making, and develop predictive models.
5. **Visualization and Reporting:** Present the graph to stakeholders through intuitive interfaces, dashboards, or custom reporting tools.
### Conclusion
In the era of increasing data complexity, knowledge graphs emerge as powerful tools, transforming the way data is understood and utilized. They represent a quantum leap in data management, offering unparalleled insights into interconnected datasets. By leveraging the power of knowledge graphs, organizations can unlock hidden value, enhance decision-making capabilities, and foster innovation. As the landscape of data evolves, the importance and applications of knowledge graphs are likely to grow, making them indispensable in the modern data-driven world.
