Unlocking the Power of Knowledge Graphs: Bridging the Gap Between Data and Insight
In the vast, interconnected realm of digital information, the challenge isn’t merely accumulating data; it lies in turning that data into meaningful insights. Knowledge graphs represent a groundbreaking approach to this challenge, offering a novel framework for bridging the gap between raw data and strategic understanding. By structuring data as interconnected nodes and edges, they enable organizations and innovators to harness the true potential of their information resources, facilitating deep insights and groundbreaking discoveries.
**Defining Knowledge Graphs**
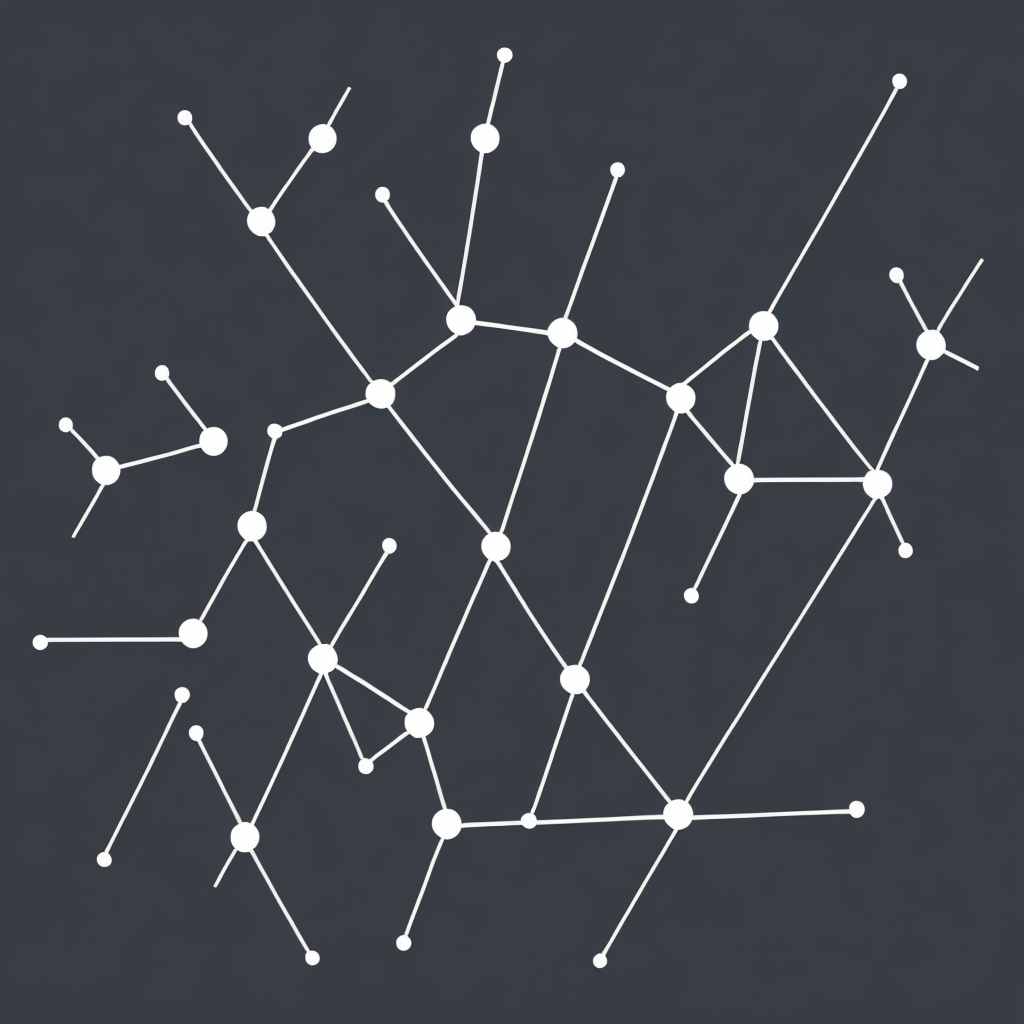
At the core of knowledge graphs is a three-dimensional data structure that organizes data into a network of nodes connected by edges. These nodes represent entities (e.g., people, places, products) while edges, either directed or bidirectional, denote the relationships between these entities (e.g., associations, causality). This relational structure is fundamentally different from traditional data storage methods, allowing for richer, more nuanced understanding and analysis.
**Knowledge Graphs in Action**
Knowledge graphs have myriad applications across industries, enhancing decision making, predicting trends, improving user experiences, and driving innovation. Here are a few illustrative examples:
– **Healthcare**: Knowledge graphs enable the integration of diverse, complex medical data, revealing new patterns, correlations, and insights that could lead to more personalized treatment options and improved patient outcomes.
– **Finance**: They help in risk assessment by connecting seemingly disparate data points, leading to more accurate financial modeling and forecasting, and supporting compliance with regulations.
– **Retail**: In the retail sector, knowledge graphs power recommendation systems that understand consumer behavior and preferences more deeply, enhancing customer experiences and driving sales.
– **Knowledge Discovery**: Across all sectors, knowledge graphs act as powerful tools for discovering new insights and fostering innovation, as they allow businesses to connect the dots that would otherwise remain unseen in conventional data stores.
**Building and Implementing Knowledge Graphs**
Creating an effective knowledge graph involves several key steps. Initially, a structured database of entities and their relationships needs to be defined, often based on semantic standards such as Schema.org or RDF (Resource Description Framework). Then, data is ingested and mapped to the graph model, which might require data cleaning, normalization, and enrichment for improved accuracy and comprehensiveness. Advanced analytics, machine learning, and natural language processing (NLP) techniques can be applied to extract value and drive insights from the graph.
**Benefits and Considerations**
The adoption of knowledge graphs comes with significant benefits, including:
– **Enhanced Data Understanding**: Knowledge graphs provide a holistic view of the interconnected nature of data, enabling deeper insights into complex systems and relationships.
– **Improved Decision Making**: By unifying and making sense of vast amounts of data, organizations can make more informed decisions, leveraging real-time insights to guide strategy and operations.
– **Efficiency and Innovation**: Knowledge graphs can streamline processes, reduce redundancy, and accelerate the discovery of new applications, fostering a culture of innovation.
However, the deployment of knowledge graphs also presents challenges, including high initial setup costs, the need for skilled personnel to manage and operate the graphs, and the complexity of maintaining and updating the models as data evolves.
**Future Horizons**
As technology advances and data becomes increasingly interconnected, knowledge graphs are poised to play an even more critical role. With advancements in AI, more sophisticated analysis, and real-time data processing, knowledge graphs can evolve to support dynamic, interactive, and predictive insights, further bridging the gap between data and insight.
In conclusion, knowledge graphs represent a transformative technology that holds the key to unlocking the full potential of data assets, facilitating the discovery of new insights, enhancing decision making, and driving innovation in diverse sectors. By continuing to refine and expand their capabilities, knowledge graphs promise to revolutionize how we use, understand, and interpret the vast oceans of data surrounding us.
