Unlocking the Power of Knowledge Graphs: Enhancing Data Connectivity and Insight Generation in the Digital Age
Introduction
In the digital age, data is omnipresent, generated from online interactions, financial transactions, user behavior, and much more. Analyzing these massive volumes of data to gain actionable insights has become essential for businesses, researchers, and policymakers alike. Enter Knowledge Graphs, a powerful tool that connects data, thereby enhancing data connectivity and insight generation.
Understanding Knowledge Graphs
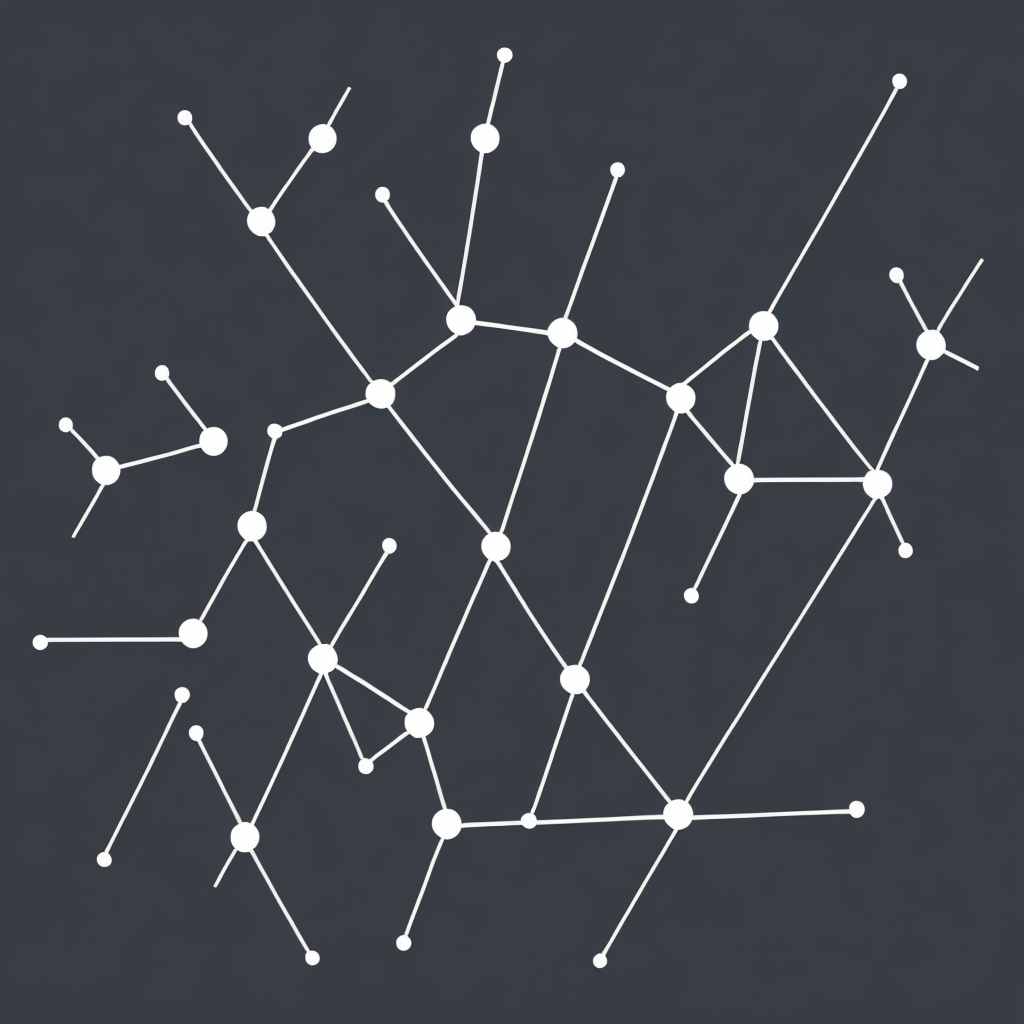
A Knowledge Graph is a semantic data structure that represents the meaningful relationships between entities, facts, concepts, and their characteristics. It can be represented in a variety of forms, but at its core, it allows the representation of information as a network of nodes and edges. Nodes typically represent entities, while edges denote relationships between these entities. In essence, Knowledge Graphs provide a structured, semantic foundation for data, creating a ‘picture’ of the relationships within it.
Key Characteristics of Knowledge Graphs
1. **Semantic Representation**: Knowledge Graphs offer a clear semantic representation of data, making it accessible for automated reasoning and intelligent data exploration.
2. **Linkage of Diverse Data Sources**: One major advantage of Knowledge Graphs is their ability to connect data from various sources. This linkage ensures that an organization has access to a more comprehensive, cohesive, and updated dataset.
3. **Facilitating Predictive Analysis**: By understanding the relationships between different data elements, knowledge graphs can be leveraged to conduct predictive analytics. This capability allows organizations to anticipate trends, behaviors, and possible outcomes, guiding informed decision-making.
4. **Enhancing Personalization**: Knowledge Graphs enable the delivery of personalized experiences for users. Through their deep understanding of relationships and patterns, they can recommend the most relevant information or products, leading to increased user satisfaction and engagement.
Applications of Knowledge Graphs
1. **Healthcare**: In the healthcare sector, Knowledge Graphs can significantly enhance diagnostic tools and patient care strategies. By integrating genetic and clinical data with population health knowledge, personalized treatments and disease predictions can be significantly improved.
2. **Retail Industry**: Knowledge Graphs can be employed to optimize customer experience by creating personalized shopping journeys based on their preferences, past purchases, and browsing history. Retailers can leverage these graphs to offer targeted recommendations and anticipate future needs.
3. **Financial Services**: In finance, a well-constructed Knowledge Graph can aid risk assessment and fraud detection. They can map out relationships between entities, leading to more effective detection of abnormal patterns and potential fraudulent activities.
4. **Internet of Things (IoT)**: Knowledge Graphs can be crucial in IoT environments, creating a smart data network that understands the state and requirements of various interconnected devices and systems, optimizing their interactions and services.
Conclusion
In the digital age, the power of Knowledge Graphs in enhancing data connectivity and insight generation cannot be overstated. As the volume and diversity of data continue to increase, so too will the importance of these graphs in facilitating more intelligent, data-driven decision-making across various sectors. However, the adoption of knowledge graphs is not just a technical consideration; it demands a thoughtful and strategic approach to model building, data integration, and the application of semantic technologies. With these considerations, an organization can optimally harness the power of knowledge graphs to transform raw data into invaluable insights, leading to improved operations, customer experiences, and overall strategic advantage.
