Unlocking the Power of Knowledge Graphs: Enhancing Data Understanding and Decision Making in the Digital Age
In the rapidly evolving digital landscape, the sheer volume of structured and unstructured data presents a unique challenge and opportunity. Traditionally, data has been harnessed by its ability to inform, predict, and optimize various operations in industries like finance, healthcare, retail, and more. However, as we step into an era of advanced analytics, emerging technologies, and pervasive intelligence, there’s a growing need for tools and methodologies that can help organizations not only consume data but also make sense of it, harness its full potential, and leverage it for informed decision-making. Here, Knowledge Graphs emerge as a critical enabler in enhancing data understanding and decision-making capabilities.
### What Are Knowledge Graphs?
At their core, Knowledge Graphs are digital representations of interconnected data that capture relationships, hierarchies, and connections between entities across various domains. Initially developed for improving search functionality on platforms like Google, knowledge graphs extend beyond mere data aggregation to form a network of knowledge that supports deeper understanding and inference. By integrating structured data, unstructured data, and semantic models, knowledge graphs allow for complex querying, advanced analytics, and personalized insights, thus augmenting its value in decision-making processes.
### Enhancing Data Understanding
Knowledge graphs improve data understanding in several key ways:
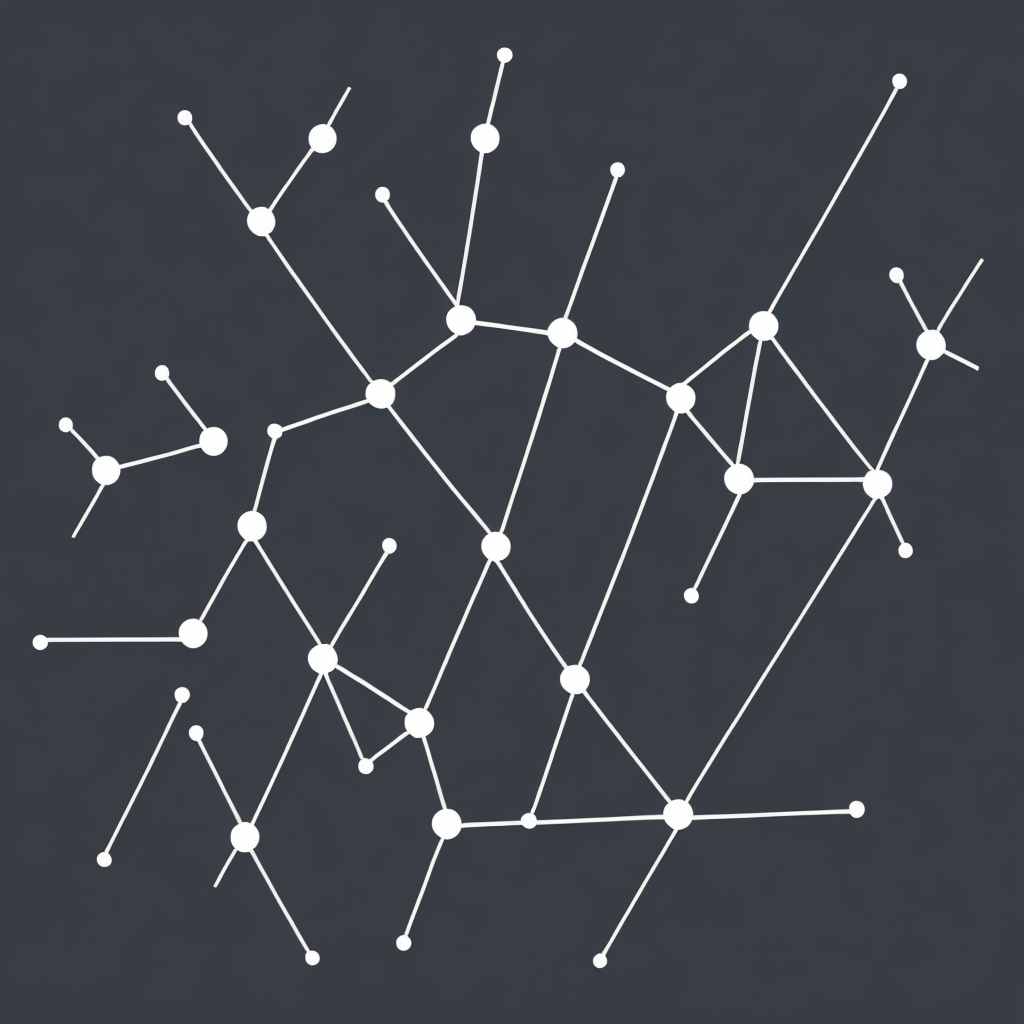
1. **Visualization of Complex Data**: Knowledge graphs provide an intuitive and visual representation of data through nodes and edges, making complex relationships and hierarchies easily consumable and understandable. This visualization aids in reducing cognitive load during data comprehension, enabling quick insights and decision-making.
2. **Integration of Heterogeneous Data**: In today’s digital landscape, data is often dispersed across multiple sources and formats. Knowledge graphs help integrate this fragmented data, bringing a unified view that reveals deeper connections and potential insights that might be missed in isolated data sets.
3. **Semantic Understanding**: Knowledge graphs support semantic understanding by mapping data to a structured, interconnected model. This semantic layer enables the extraction of nuanced meanings and relationships, thereby enhancing the depth of information and insights derived from the dataset.
### Decision-Making Enhancement
Knowledge graphs significantly enhance decision-making in several domains:
1. **Predictive Analytics**: By analyzing relationships and patterns within the network of knowledge, predictions can be made with greater accuracy. This is particularly valuable in complex domains like finance and healthcare, where decisions need to be based on predictive insights.
2. **Optimization of Operations**: In industries such as logistics and supply chain management, knowledge graphs can reveal bottlenecks, optimize routes, and predict optimal inventory levels based on historical and current data trends.
3. **Personalization and Customization**: Knowledge graphs are instrumental in personalizing user experiences across various sectors. By understanding user behavior, preferences, and context, businesses can tailor products, services, and marketing strategies more effectively.
### Applications Across Industries
Knowledge graphs have found applications in various industries:
– **Healthcare**: By integrating patient data, medical history, and drug interactions, medical professionals can make more informed treatment decisions, improving patient outcomes.
– **Finance**: Knowledge graphs can analyze financial transactions, uncover patterns of fraud, and assess creditworthiness through deeper data analysis.
– **Retail**: Retailers use knowledge graphs to understand consumer behavior, personalize shopping experiences, and optimize inventory management.
– **Transportation**: Mapping out vehicles, routes, and traffic data through knowledge graphs can optimize logistics and fleet management, reduce costs, and enhance safety.
### Conclusion
In the digital age, the power of knowledge graphs cannot be overstated. They offer a comprehensive framework for understanding complex datasets, integrating diverse data sources, and enabling informed decision-making through advanced analytics. From enhancing data visualization for better comprehension to optimizing operations, improving personalization, and facilitating predictive analytics, knowledge graphs are a critical tool in harnessing the full potential of digital data for growth, innovation, and competitive advantage.
